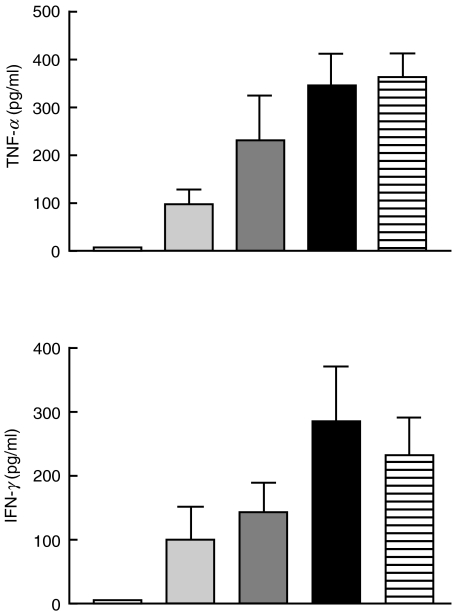
Fig. 1.
Dose-dependent production of TNF-α and IFN-γ by T cells after incubation 36 h with increasing concentrations of C1q-bearing immune complexes. Using a special ELISA, the concentration of TNF-α and IFN-γ was measured in the supernatants. Results are means ± s.e.m. of five independent experiments. □, C1qIC 0 µg/ml;  , C1qIC 100 µg/ml;
  , C1qIC 200 µg/ml; ▪, 400 µg/ml;
  , 800 µg/ml.

