
Fig. 6.
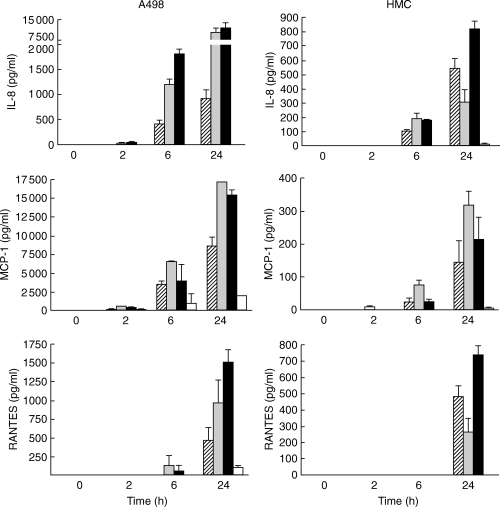
IL-8, MCP-1 and RANTES secretion following stimulation of human renal epithelial cells, A498 and primary HMC by E. coli CFT-073 (striped bars), IL-1β (grey bars) or in combination (black bars) expressed as means with s.d.. Non-stimulated controls (open bars) were usually under detection limit (n = 3 in each group).