
Fig. 2.
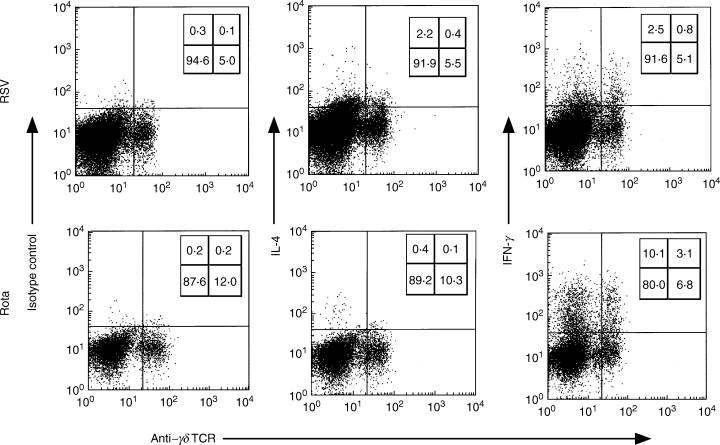
Representative plots of IL-4 and IFN-γ production among the CD3+ T cells from RSV- or rotavirus-infected infants upon stimulation with PMA and ionomycin for 4 h. Numbers indicate the percentage of CD3+ T cells stained in each of four quadrants.