
Figure 1.
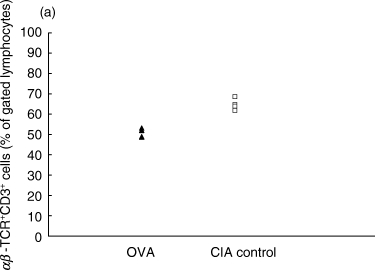
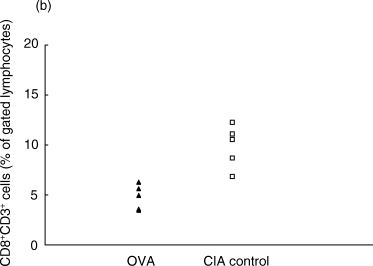
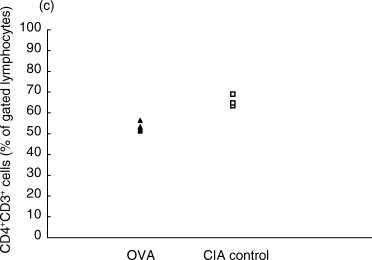
Proportions of αβ T cell populations in OVA-inhibited (n = 5) and control CIA (n = 5) animals at day 7 after immunization, as determined by flow cytometry. (a) The total T cell population defined by CD3+αβ-TCR+ cells was lower in the OVA-inhibited group (P < 0·01) using Student's t-test. This decrease was reflected in both the (b) CD8+ CD3+ population (P < 0·01) and in the (c) CD4+ CD3+ population (P < 0·01). This experiment was repeated once with similar results. ▴, OVA; □, CIA control.