
Fig. 2.
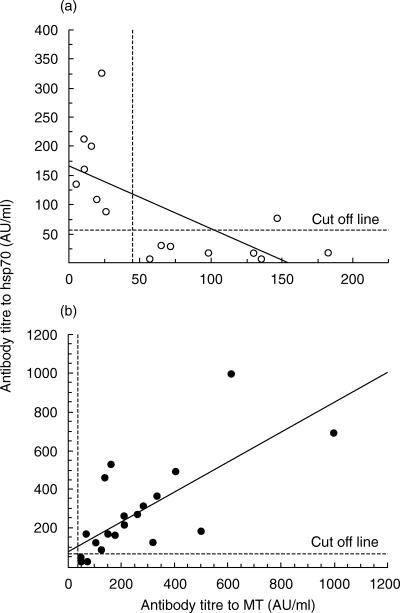
The relation between antibody to MT and antibody to hsp70 was calculated by regression analysis. Each plot represented one subject that showed positive to MT and/or hsp70. Correlation between two antibodies was analysed by nonparametric Spearman test. (a) Group I plus Group II (r* = −0·660, P = 0·0053). (b) Group III (r = 0·719, P = 0·0013).*Correlation coefficient.