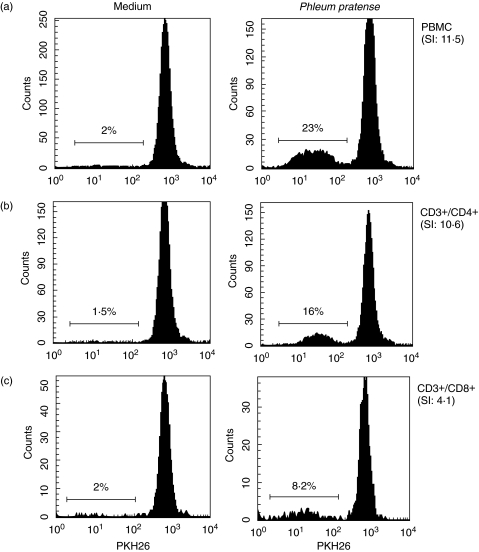
Fig. 1.
Flow cytometric analysis of (a) whole PBMC, and of (b) CD4+ and (c) CD8+ T-lymphocyte subsets proliferation in one grass pollen atopic subject, in response to grass pollen (P. pratense). Flow cytometry histograms show PKH26 fluorescence on (a) total cells (PBMC), (b) CD3+/CD4+ T-cells and (c) CD3+/CD8+ T-cells. Values represent percentages of cells that have proliferated as a proportion of all gated cells. Stimulation index (SI) represents the proportion of cells proliferating in response to P. pratense divided by the proportion of cells undergoing background proliferation (in medium only).

