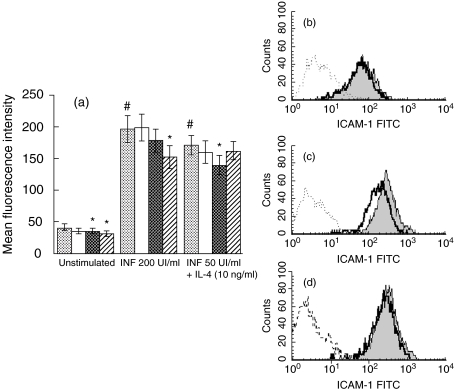
Fig. 1.
Flow cytometry analysis of ICAM-1 expression on BEAS-2B incubated by KGF. (a) Cells were cultured on collagen-coated flasks with different concentrations of KGF for 24 h under basal conditions or stimulated with TNF (200 UI/ml) or the combination of TNF (50 UI/ml) and IL-4 (10 ng/ml). Results for six different experiments are expressed as mean fluorescence intensity (MFI) ± s.e.m. corrected by subtracting the mean fluorescence of the negative control. (b, c, d) FACS analysis was reported for one representative of the six experiments. The bold and shaded lines show the data obtained with anti-ICAM-1 antibody in BEAS-2B incubated with or without KGF, respectively, whereas the dotted line illustrated the results obtained with the isotype control. BEAS-2B incubated or without KGF (30 ng/ml) were either unstimulated ((b), MFI: 56 and 67, respectively), activated with TNF ((c), MFI: 178 and 286) or with TNF plus IL-4 ((d), MFI: 176 and 211). #P < 0·05: significantly different from unstimulated conditions; *P < 0·05, a significant decrease induced by KGF above the level in the corresponding control.  , Control; □, KGF 10 ng/ml;
  , KGF 30 ng/ml;
  , KGF 100 ng/ml.

