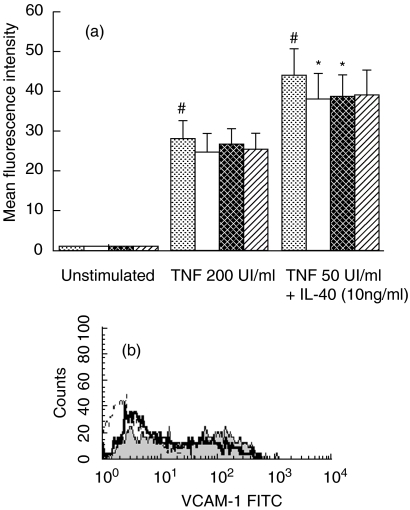
Fig. 2.
Flow cytometry analysis of the VCAM-1 expression on BEAS-2B cells incubated with KGF. Cells were cultured in collagen-coated flasks with different concentrations of KGF for 24 h under basal conditions or stimulated with TNF (200 UI/ml) or the combination of TNF (50 UI/ml) and IL-4 (10 ng/ml). (a) Results for seven different experiments are expressed as mean fluorescence intensity (MFI) ± s.e.m. corrected by subtracting the mean fluorescence of the negative control. (b) One representative experiment, histograms obtained by FACS analysis with isotype control (dotted line) and anti-VCAM-1 antibody in BEAS-2B cells incubated with (bold line, MFI = 20·5) and without KGF at 30 ng/ml (shaded line, MFI = 30·2); the cells were stimulated with TNF plus IL-4. #P < 0·05: significantly different from unstimulated condition; *P < 0·05, a significant decrease induced by KGF above the level in the corresponding control.  , Control; □, KGF 10 ng/ml;
  , KGF 30 ng/ml;
  , KGF 100 ng/ml.

