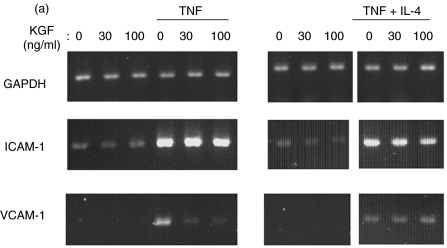
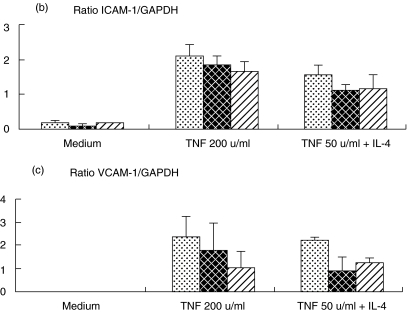
Fig. 5.
RT-PCR analysis of the mRNA expression on BEAS-2B incubated with and without KGF. Total RNA from BEAS-2B cultures were extracted after 5 h of culture, and then ICAM-1and VCAM-1 mRNA expression was analysed by semiquantitative RT-PCR. (a) A representative experiment was reported illustrating the bands obtained for GAPDH, ICAM-1 and VCAM-1 mRNA analysis. Quantification of mRNA was achieved by gel analysis and expressed as a ratio with GAPDH mRNA. (b) The mean ± SEM of four and three experiments were reported for ICAM-1 (b) and VCAM-1 (c), respectively.  , Control;
  , KGF 30 ng/ml;
  , KGF 100 ng/ml.


