Abstract
Defects of T cell (Tc) proliferation have been demonstrated in several autoimmune diseases. Detailed mechanisms governing activation and proliferation of Tc are still not completely known. Here we show that under certain conditions human peripheral blood lymphocytes, once activated by anti-CD3, fail to respond to a subsequent restimulation via the Tc-receptor. Peripheral blood mononuclear cells (PBMC) were preactivated by anti-CD3 for 96 h following restimulation by anti-CD3, interleukin (IL)-2 and other mitogens. In control experiments unstimulated PBMC were incubated in medium alone. Immunophenotypes were analysed by flow cytometry. Cytokine production was determined by reverse transcription-polymerase chain reaction and intracellular signalling protein contents of Tc were compared by Western blotting. Furthermore, apoptosis was detected by terminal deoxyribose transferase-mediated deoxyuridine triphosphate nick end labelling assay. Unstimulated PBMC proliferate well after subsequent stimulation with anti-CD3, whereas IL-2 induces only limited proliferation. In contrast, preactivated cells respond only minimally to restimulation with anti-CD3, but IL-2 induces a marked proliferation. Both preactivated and unstimulated Tc respond well to restimulation by phytohaemagglutinin (PHA). In contrast, preactivated Tc show only a weak response to concanavalin A. Interestingly, when cells have been allowed to rest for 168 h, the responsiveness of preactivated Tc is restored. Immunoblots reveal that preactivated cells have a higher intracellular content of ζ-chain and p56lck. No differences are found concerning apoptosis after restimulation with anti-CD3 or the expression of ERK 1/2. The unresponsiveness to restimulation is due to an impairment of the transcription of the IL-2 gene and this defect is temporary. Despite the lack of proliferation, preactivated Tc phenotypically maintain an intermediate stage of activation. These data show how the same cell population can change its functional phenotype into a non-responder state.
Keywords: anergy, cellular activation, suppression, T lymphocytes, tolerance
INTRODUCTION
Activation of resting T cells (Tc) in response to antigen (Ag) is a complex process in which T cell receptor (TCR) interaction with peptide and major histocompatibility complex (MHC) components is followed by phosphorylation of intracellular molecules, which lead to the activation of gene transcription. One of the most important among these events is the generation of interleukin (IL)-2 [1].
TCR engagement by peptide-MHC is not, by itself, sufficient to allow proliferation and effector functions. Rather, for a resting Tc to produce sufficient amounts of IL-2 for autocrine- and paracrine-driven clonal expansion, involvement of co-stimulatory signals provided by Ag-presenting cells (APC) is required [2–4]. On the other hand, the function of APC is influenced by a variety of mechanisms, including effects mediated by activated Tc. Anergic T lymphocytes may be capable of modulating the Tc-activating capacity of APC [5]. Furthermore, peripheral blood mononuclear cells (PBMC) partially depleted of accessory cells were unresponsive after stimulation with anti-CD3 [6]. Also, B cells are able to induce anergic CD8+ cells when presenting Ag [7].
The detailed mechanisms governing activation and proliferation of activated Tc, however, are still not known completely and have usually been investigated using murine T cell lines and clones which have an inherent proliferative capacity. For instance, it has been demonstrated that, in mice, proteins that stimulate Tc in a Vβ-specific manner can induce a state of anergy [8]. Under certain conditions, soluble viral proteins are able to induce tolerance in mice [9].
The current experiments were designed to examine if human Tc unresponsiveness may also appear even though sufficient accessory cell signals are present. We will show that in preactivated human peripheral blood Tc conventional TCR-mediated stimulation in the presence of co-stimulatory signals is neither sufficient to reactivate IL-2 secretion nor to sustain proliferation and that this defect is transient.
MATERIALS AND METHODS
Isolation and preincubation of PBMC
After informed consent, PBMC from healthy voluntary donors were isolated by density gradient centrifugation on Ficoll Paque® according to the manufacturer's instructions (Pharmacia, Uppsala, Sweden). After two washing steps, cells were resuspended in medium (RPMI-1640; GIBCO, Paisley, Scotland, UK) supplemented with 10% fetal calf serum (GIBCO), 50 U/ml penicillin and 50 ng/ml streptomycin (Seromed; Berlin, Germany). Cells were then cultured on Petri dishes (Costar, Acton, MA, USA; 200 × 10 mm) (107/ml) in the presence (= preactivated; PA) or absence (= unstimulated; US) of a CD3 monoclonal antibody (MoAb) (IOT-3, Immunotech, Marseille, France) at a concentration of 10 ng/ml. After 48 h of incubation at 37°C in a humidified atmosphere containing 5% CO2, supernatants were removed and both populations were cultured for another 48 h (total: 96 h before restimulation) or 120 h (total: 168 h before restimulation) in medium alone.
Restimulation of PBMC with soluble anti-CD3 and IL-2, concanavalin A (Con A) and phytohaemagglutinin (PHA)
After preincubation for a total of 96–168 h (see above) cells were harvested, washed twice in medium and cultured in 96-well microtitre plates (Costar; 105 cells/200 µl/well). Cells were either cultured with medium alone or restimulated with anti-CD3 (10 ng/ml), IL-2 (40 U/ml; Genzyme, Cambridge, MA, USA), anti-CD3+ IL-2, PHA (6·25 µg/ml, GIBCO) or Con A (10 ng/ml; ICN Pharmaceuticals, Costa Mesa, CA, USA). Furthermore, restimulation was tested with different IL-2 concentrations (40, 20, 10, 4, 2 and 1 U/ml). After 48 h cells were pulsed with [3H]-thymidine (1 µCi/well) for another 18 h and then harvested (1295–001 Cell Harvester, LKB Wallac, Turku, Finland). Incorporated activity was measured with Scintillation Counter (1205 Betaplate ™, LKB, Wallac) and expressed as counts per minute (cpm). Furthermore, cells were pulsed with [3H]thymidine 24 h, 72 h, 120 h and 144 h after the second stimulation.
Immunofluorescence staining and FACS analysis
Cells (106) resuspended in 100 µl phosphate buffered saline (PBS) containing 1% bovine serum albumin (BSA; Sigma, St Louis, MI, USA) and 0·3% sodium azide were stained with different MoAbs for 20 min on ice, as described elsewhere [10]. After two washing steps leucocytes were resuspended in 250 µl PBS and 15 000 cells were analysed on a flow cytometer (FACScan, Becton-Dickinson, Mountain View, CA, USA). For two-colour analysis, cells were stained with fluoroisothiocyanate (FITC)-conjugated MoAbs to CD25, HLA-DR, CD28 and CD69 (all purchased from Becton-Dickinson) or CD95 (Immunotech, Marseille, France). T cells were counterstained with phycoerythrin (PE)-labelled anti-CD3 (Becton-Dickinson). Isotype-matched mouse MoAbs (IgG1 and IgG2) conjugated with FITC or PE (Becton-Dickinson) were used as negative controls.
Detection of IL-2, CD25 and interferon (IFN)-γ mRNA by reverse transcriptase polymerase chain reaction (RT-PCR)
Four hours after the second stimulation with anti-CD3 (IOT-3 MoAb) and IL-2 adherent and non-adherent Tc were harvested for analysis by RT-PCR, as described elsewhere [11].
The cDNA was synthesized in a reverse transcription reaction mixture (First Strand cDNA Synthesis Kit, Pharmacia Biotech, Brussels, Belgium) containing 4 µg total RNA from cultured PBMC. RNA from 106 cells was isolated by a modified guanidinium isothiocyanate–acid phenol extraction procedure using RNAzol™B (Biotecx Laboratories, Houston, TX, USA). Finally, RNA was dissolved in 20 µl of RNAse free distilled water and stored in liquid nitrogen. cDNA synthesis was performed according to the manufacturer's instructions starting with 4 µg of total RNA. Aliquots of the cDNA product (β-actin gene as a positive internal control, human (h)IL-2, hIL-2 receptor (R), hIFN-γ) were used for RT-PCR with the following primer pairs (hβ-actin: 5′primer 5′-AGG CCG GCT TCG CGG GCG AC-3′; 3′primer: 5′-CTC GGG AGC CAC ACG CAG CTC-3′; hIL-2: 5′primer 5′-CAT TGC ACT AAG TCT TGC ACT TGC CA-3′; 3′primer: 5′-CGT TGA TAT TGC TGA TTA AGT CCC TG-3′; hIL-2 R: 5′primer 5′-GAA TTT ATC ATT TCG TGG TGG GGC A-3′; 3′primer: 5′-TCT TCT ACT CTT CCT CTG TCT CCG-3′; hIFN-γ: 5′primer 5′-GCA TCG TTT TGG GTT CTT TTG GCT GTT ACT GC-3′; 3′primer: 5′-CTC CTT TTT CGC TTC CCT GTT TTA GCT GCT GG-3′). After amplification, an aliquot of each reaction product was subjected to electrophoresis on a 2% agarose gel in Tris-acetate-EDTA buffer. The PCR products were visualized by ethidium bromide staining and photographed.
Determination of intracellular ζ-chain, ERK1/2 and p56lck expression by Western blot
Six hours after the second incubation with anti-CD3, 5 × 10⁶ cells of both populations, US and PA, were harvested and washed twice with PBS. After resuspending in lysis buffer (TIS 50 mM, KCl 50 mM, MgCl 5 mM, Na-Vanadat 1 mM, NaF 5 mM, aprotinin 20 mg/ml, leupeptin 20 mg/ml, nonidet P40 1%) probes were kept on ice for 45 min and supernatants were electrophoresed by SDS-PAGE (12%), followed by transfer to nitrocellulose membranes, as described previously [12]. Strips were then incubated wth MoAbs to ζ-chain (clone 6B10·2; mouse-IgG1; Santa Cruz Biotechnology Inc., Santa Cruz, CA, USA), ERK 1/2 (clone E-4; mouse-IgG2a; Santa Cruz Biotechnology Inc.) and p56lck (clone 3A5; mouse-IgG2b; Sigma), and actin as a housekeeping protein (polyclonal rabbit-Ig, Sigma). In a second step horseradish peroxidase conjugated polyclonal rabbit-antimouse Ig and swine-antirabbit Ig (Dako, Copenhagen, Denmark) were used to visualize results by electro-chemoluminescence (Amersham, Bucks, UK).
Detection and determination of apoptosis by terminal deoxyribose transferase-mediated deoxyuridine triphosphate nick end labelling (TUNEL) assay
Six hours after the second incubation with anti-CD3, apoptosis of Tc in both populations were determined with an in situ cell death detection kit using the TUNEL method (Roche, Mannheim, Germany). To identify Tc in FACS analysis, cells were double-stained with a PE-labelled anti-CD3 MoAb (Becton-Dickinson). The cells were then washed (in PBS containing 1% BSA), fixed (in 4% paraformaldehyde in PBS; pH 7·4) and permeabilized (in 0·1% Triton-X in 0·1% sodium citrate) according to the manufacturer's instructions. Finally, cells were stained with the provided TUNEL reaction mixture (using FITC as fluorescence dye).
Statistical analysis
Experiments were performed in triplicate and mean values ± s.e.m. were calculated. Differences were analysed using Student's t-test and P-values < 0·05 regarded as statistically significant.
RESULTS
Proliferation of T cells after restimulation
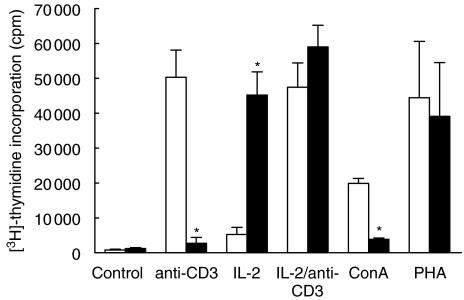
PBMC preincubated for 96 h in medium alone (US) showed a good proliferative response to subsequent stimulation with anti-CD3 (50 324 ± 7789 cpm), while IL-2 induced only limited proliferation (5255 ± 2025 cpm); proliferation induced by IL-2 + anti-CD3 (47 464 ± 6952 cpm) was comparable to that by anti-CD3 alone under the experimental conditions here (Fig. 1).
Fig. 1.
T cell proliferation of US and anti-CD3 PA PBMC in response to anti-CD3, IL-2 and other mitogens. Proliferative response of US and PA PBMC to anti-CD3, IL-2 + anti-CD3, PHA or Con A. [3H]-thymidine uptake is given in cpm (*P < 0·05). □, US; ▪, PA.
In contrast, cells which had been preactivated (PA) for 48 h with anti-CD3 followed by 48 h incubation in medium (Fig. 1) responded only minimally to subsequent stimulation with anti-CD3 (2726 ± 1677 cpm; P < 0·05 compared to the US population). Addition of IL-2 alone (45 224 ± 6625 cpm; P < 0·05 compared to the US population) or IL-2 plus anti-CD3 (59 027 ± 6173 cpm) induced a marked proliferative response.
Both cell populations showed a very good proliferative response to PHA (US: 44 461 ± 16 122 cpm; PA: 39 104 ± 15 438 cpm), whereas the response to Con A was seen primarily among US cells (US: 19 877 ± 1431 cpm; PA: 3878 ± 344 cpm; P < 0·05) and thus had effects similar to anti-CD3 (Fig. 1).
Control experiments with Tc preincubated with an unrelated murine IgG1 MoAb showed a similar proliferative response to subsequent TCR activation as US cells, excluding a non-specific effect via Fc-receptor blockade. In all experiments, cell viability was between 97 and 100%.
We observed that there was no difference in the loss of proliferative response of PA Tc to anti-CD3 when IOT-3 MoAb containing supernatants have been replaced by medium after 48 h (as described above), 24 h, 72 h or 96 h (data not shown).
Dose-dependent proliferation of preactivated cells in the presence of IL-2
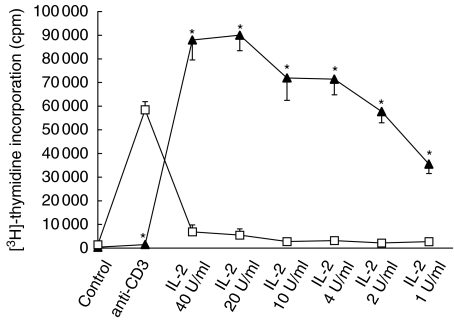
As shown in Fig. 2, proliferation of PA lymphocytes to subsequent stimulation with IL-2 was dose-dependent (40 U/ml: 88 002 ± 8432 cpm; 20 U/ml: 90 037 ± 6566 cpm; 10 U/ml: 71 935 ± 9480 cpm; 4 U/ml: 71 464 ± 6670 cpm; 2 U/ml: 57 736 ± 4727 cpm; 1 U/ml: 35 552 ± 4033 cpm). However, even at low concentrations PA Tc showed higher proliferation than US cells (40 U/ml: 6870 ± 2911 cpm; 20 U/ml: 5499 ± 2611 cpm; 10 U/ml: 2754 ± 1046 cpm; 4 U/ml: 3176 ± 349 cpm; 2 U/ml: 2168 ± 747 cpm; 1 U/ml: 2719 ± 418 cpm; P < 0·05 for all values PA versus US);
Fig. 2.
Dose-dependent response of T cells to IL-2. PA cells show a strong proliferative response to IL-2. This response is dependent upon IL-2 concentration. Again, PA T cells show almost no proliferation after restimulation with anti-CD3. Compared with PA T cells, US cells proliferate strongly after exposure to anti-CD3 but respond only weakly to IL-2 (*P < 0·05). □, US; ▴, PA.
In this series of experiments, anti-CD3: 1483 ± 546 cpm (PA) versus 58 475 ± 3459 cpm (US) P < 0·05; control: 389 ± 45 cpm (PA), 1442 ± 170 cpm (US).
Proliferation does not occur within 6 days after restimulation of preactivated Tc
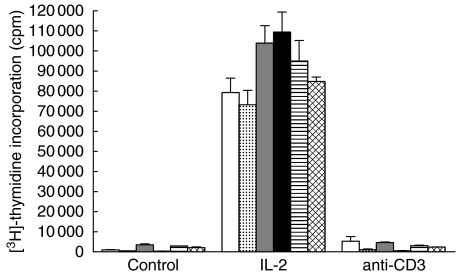
Furthermore, we tested if proliferation occurs at other time-points (earlier or later) than 48 h after the second stimulation (Fig. 3). Therefore, PA Tc were pulsed with [3H]-thymidine at different times after the restimulation with anti-CD3 or IL-2. Although it seems that proliferation of PA Tc reached its maximum 96 h after the restimulation with IL-2 (within 24 h: 79 332 ± 48 h: 73 206 ± 7237 cpm; 72 h: 103 934 ± 8679 cpm; 96 h: 109 472 ± 9871 cpm; 120 h: 94 992 ± 10 189 cpm; 144 h: 84 793 ± 2186 cpm; differences n.s.), we could not detect a relevant proliferative response within 6 days after the restimulation with anti-CD3 [within 24 h 5295 ± 2276 cpm (control: 1007 ± 154 cpm); 48 h: 1069 ± 368 cpm (control: 426 ± 71 cpm); 72 h: 4645 ± 313 cpm (control: 3516 ± 441 cpm); 96 h: 521 ± 161 cpm (control: 364 ± 57 cpm); 120 h: 3030 ± 278 cpm (control: 2868 ± 57 cpm); 144 h: 2400 ± 92 cpm (control: 2104 ± 346 cpm)].
Fig. 3.
T cell proliferation at different time-points after restimulation. PA cells were restimulated 4 days after the first stimulation. Proliferation was measured at different times after restimulation for 6 days. [3H]-thymidine uptake is given in cpm. □, 24 h after restimulation;  , 48 h after restimulation;
  , 72 h after restimulation; ▪, 96 h after restimulation;
  , 120 h after restimulation;
  , 144 h after restimulation.
Loss of unresponsiveness after prolonged incubation
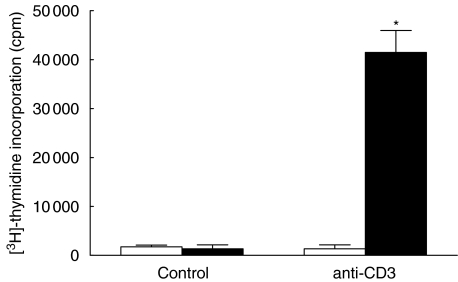
We then asked whether the Tc unresponsiveness to secondary TCR ligation was permanent or transient. When cells were allowed to rest for 168 h rather than 48–96 h, the responsiveness of PA lymphocytes was restored. Then, a second stimulation with anti-CD3 induced a strong [3H]-thymidine uptake compared to PA Tc which had rested for only 96 h (96 h: 1337 ± 832 cpm; 168 h: 41 479 ± 4488 cpm; P < 0·05; Fig. 4).
Fig. 4.
Restoration of T cell response to anti-CD3 after prolonged preincubation. Compared to a preincubation period of 96 h, T cells cultured for 168 h in the presence of anti-CD3 show a good proliferation to a second CD3 challenge. [3H]-thymidine uptake is given in cpm. □, 96 h; ▪, 168 h.
Analysis of function and differentiation associated antigens
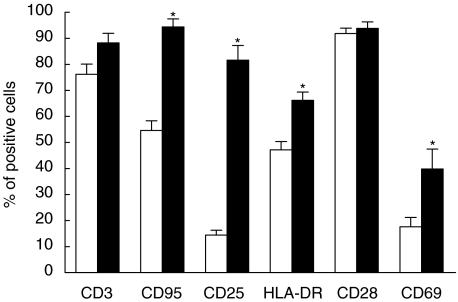
We next analysed whether the differential responsiveness to TCR ligation would be reflected in differences of cell surface molecule expression. As shown in Fig. 5, after the first 96 h of culture PA cells showed a slightly higher percentage of CD3+ cells than US cells, but without statistical significance (US: 76% ± 4 versus PA: 88% ± 4 of all lymphocytes). As expected, PA compared to US cells showed higher surface expression of CD25 (US: 14% ± 2 versus PA: 82% ± 5; P < 0·05), of HLA-DR (US 47% ± 3 versus PA: 66% ± 3; P < 0·05), CD69 (US: 18% ± 4 versus PA: 40% ± 8; P < 0·05), and CD95 (US: 55% ± 4 versus PA: 94% ± 3; P < 0·05). No significant difference was observed for CD28 expression (US: 92% ± 2 versus PA: 94% ± 2).
Fig. 5.
Immunophenotype of T cells after 96 h of incubation with medium or CD3. Immunophenotype of T cells from PBMC cultured for 96 h in medium (US) or in the presence of anti-CD3 (PA). CD3 bars show the percentage of T cells among all lymphocytes, whereas percentages of CD95, CD25, HLA-DR, CD28 and CD69 refer to all T cells (*P < 0·05). □, US; ▪, PA.
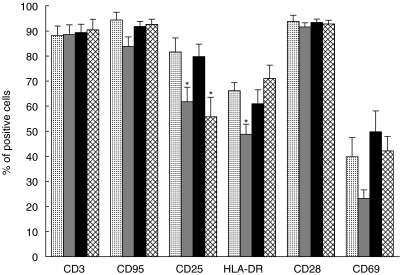
When PA cells were reincubated in medium alone they underwent a significant (P < 0·05) decrease of CD25 (62% ± 6) and HLA-DR (49% ± 4). The decreases observed for CD95 (84% ± 4) and CD69 (23% ± 3) expression failed to be statistically significant. Again, no change of CD28 expression (92% ± 2) was observed. However, as shown in Fig. 4, despite their failure to proliferate, PA cells restimulated with anti-CD3 maintained their surface molecule expression to a similar degree as after the first stimulation (CD25: 80% ± 5, HLA-DR: 61% ± 6, CD28: 93% ± 1, CD95: 92% ± 2 and CD69 50% ± 8). With the exception of CD25+ cell percentages (56% ± 8; P < 0·05), PA lymphocytes, once restimulated with IL-2 also maintained the expression of these activation induced molecules (HLA-DR = 71% ± 5, CD28 = 93% ± 1, CD69 = 42% ± 6, CD95 = 93% ± 2; Fig. 6).
Fig. 6.
Immunophenotype of PA T cells from PBMC cultured for 96 h in the presence of anti-CD3 (PA). Then T cells were cultured for another 48 h in medium alone following primary stimulation (PA + medium). Furthermore, PA T cells were restimulated by anti-CD3 (PA + CD3) or IL-2 (PA + IL-2). CD3 bars show the percentages of T cells among all lymphocytes, whereas percentages of CD95, CD25, HLA-DR, CD28 and CD69 refer to all T cells (*P < 0·05 compared to PA).  , PA;
, PA;  , PA + medium; ▪, PA anti-CD3;
  , PA + IL-2.
These data suggest that Tc restimulated with anti-CD3 or IL-2, irrespective of their proliferative response, continued to express surface molecules associated with cellular activation. However, in the context of IL-2-mediated proliferation (but not TCR ligation) IL-2 receptors (IL-2R) were significantly down-regulated.
Expression of IL-2, CD25, and IFN-γ mRNA
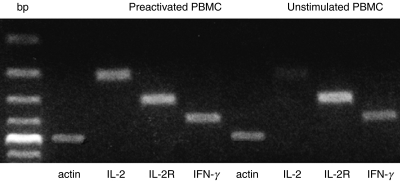
The data on proliferation and cell surface molecule expression suggested that Tc restimulated with anti-CD3 after prior TCR-mediated cell stimulation were refractory in IL-2 production and fell into a non-proliferating state. These cells were, however, capable of activating other features characteristic of T lymphocyte activation. This aspect was investigated further by analysis of cytokine gene expression. Four hours after stimulation by anti-CD3, US PBMC showed a marked expression of IL-2, IFN-γ and IL-2R mRNA. In contrast, after restimulation with anti-CD3, PA cells expressed only small amounts of IL-2 mRNA, greater amounts of IFN-γ and very large amounts of IL-2R mRNA (Fig. 7). Thus, these cells had a significant deficiency in IL-2 gene transcription.
Fig. 7.
Expression of mRNA for transcription of IL-2, IL-2R and IFN-γ in US and anti-CD3 PA PBMC. RT-PCR of IL-2, IL-2R and IFN-γ of PBMC 4 h after (re)stimulation by anti-CD3. US PBMC were incubated for 96 h in medium before stimulation, whereas PA cells were incubated with anti-CD3 for 48 h followed by 48 h in medium before restimulation.
Expression of intracellular ζ-chain, ERK1/2 and p56lck
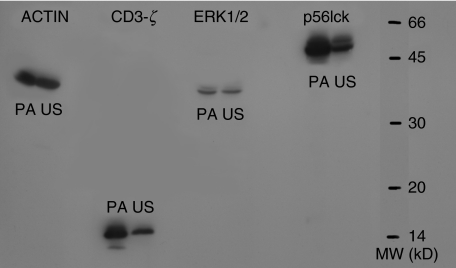
We then asked whether a difference in the expression of intracellular messenger proteins could explain, at least partly, the proliferative unresponsiveness of preactivated cells to anti-CD3. Surprisingly, immunoblots revealed that PA cells had a higher intracellular content of ζ-chain protein than US cells after exposure to anti-CD3. By the nature of their different molecular weights both forms, native and phosphorylated ζ-chain, appeared to be increased in PA cells. The tyrosine kinase, p56lck, activated downstream of ζ-chain in the activation cascade, was significantly elevated in PA cells after renewed TCR ligation (Fig. 8), suggesting an intact intracellular signal transduction. Furthermore, there was no difference in the expression of ERK1/2, another activation-induced protein kinase downstream of the TCR stimulation.
Fig. 8.
Intracellular and CD3-ζ-chain, ERK1/2 and p56lck expression. PA T cells were incubated with anti-CD3 for 48 h followed by 48 h in medium, US cells were incubated for 96 h in medium; 6 h after a second stimulation with anti-CD3, cells were analysed for intracellular messengers by Western blotting.
Apoptosis after the second incubation with CD3
Stimulation of Tc also leads to activation-induced programmed cell death [13]. To determine whether deficient proliferative response is a consequence of apoptosis, we measured DNA fragments in Tc (re)stimulated via CD3. Lymphocytes preincubated in medium alone for 4 days and then exposed to anti-CD3 revealed 13·3% ± 0·9 of TUNEL-positive cells. On the other hand, in PBMC once prestimulated with anti-CD3 and then restimulated via the TCR, 18·3% ± 4·9 of Tc appeared apoptotic (n.s.).
DISCUSSION
The data presented reveal that human peripheral blood T lymphocytes, once activated by anti-CD3, fail to proliferate to a second stimulation via the TCR. This unresponsiveness to restimulation is due probably to an impairment of TCR-mediated transcription of the IL-2 gene. However, these cells proliferate well to exogenous IL-2 as well as IL-15 (data not shown). In fact, despite the lack of proliferative response, anti-CD3 preactivated cells, after renewed TCR ligation, maintain an intermediate stage of activation: they continue to express high amounts of IL-2R both at the surface and the mRNA level, as well as surface CD69 and HLA-DR. In contrast, anti-CD3 preactivated Tc lose CD25 surface expression when subsequently resting in medium. Interestingly, however, resting for a prolonged period restores the proliferative response to TCR ligation. In TCR a/b transgenic mice, anergy was reversed in the absence of Ag [14].
Although a defective accessory cell function could contribute to the deficiency of preactivated Tc to continue proliferation after restimulation of the TCR within a certain period of time, this seems unlikely as co-stimulatory molecules are expanded significantly on these monocytes (data not shown). These results suggest that the deficient Tc responsiveness lies within the Tc themselves.
As expected, after the primary stimulation with anti-CD3, Tc show high levels of HLA-DR, CD25 and CD69 molecule expression, reflecting their activated state. Although a second challenge via the TCR within 96 h fails to induce a proliferative response, incubation of these T lymphocytes for another 2 days in medium alone restores their proliferative capacity. This is in line with observations that Ag stimulation of murine T-helper-clones leads to only transient unresponsiveness to further antigenic stimulation [15]. However, this has not yet been observed for primary Tc populations.
Recent data show that after Ag-specific activation murine CD8+ cells become unresponsive. These CD8+ Tc are able to exhibit some effector functions, but fail to proliferate. Similar to our results these cells secrete IFN-γ, but fail to produce IL-2 [16]. Again, IL-2 restores proliferation of murine CD8+ cells. This lack of proliferation is not due to increased activation-induced cell death [17]. As demonstrated by DNA fragment labelling, in our experiments an increase of apoptosis after a second challenge via the TCR can also be ruled out as a possible cause of this unresponsive state.
ERK1/2 activity is required for signal transduction and thus IL-2 transcription [18]. Anti-CD3 preactivated Tc, which fail to produce IL-2, reveal similar amounts to Tc in control experiments of ERK1/2 after a second stimulation via the TCR.
Importantly, upon restimulation with anti-CD3 96 h after first TCR ligation, even though non-responsive in terms of IL-2 production and proliferation, Tc continue to express surface molecules associated with a state of activation, because they continue to produce and express a variety of molecules such as IFN-γ, IL-2R and other activation-associated cell surface molecules, but not IL-2. Thus, many of their effector functions in the G1-phase, but not their progression into a mitotic cell cycle, is sustained. The analysis was performed 4 h after restimulation. Immunofluorescence analysis (and also TR-PCR results not shown) 96 h after the first stimulation demonstrate clearly that CD25 is expressed at high density before restimulation. These results make it probable that the signal determined 4 h after restimulation holds over from the first stimulation.
It has been demonstrated that Tc responsiveness can be induced by modulating the TCR with CD3 in the absence of accessory cells [19], but the phenomenon was induced only by a MoAb which was able to cross-link the TCR and dependent on the induction of calcium influx. Furthermore, CD3 unresponsiveness also appeared in PBMC, which were partially depleted of accessory cells [6]. Our results reveal that despite the presence of adequate co-stimulatory molecules Tc reactivation via the TCR can also lead to temporary unresponsiveness. The conditions in our experiments, where no cell population have been (partially) depleted, may reflect the physiological situation far more. The rate-limiting events for IL-2 production can be overcome by bypassing the TCR via mitogens such as PHA, but not by ligation of the TCR. Furthermore, restimulation via CD2 induces stronger proliferation of anti-CD3 preactivated Tc than of untreated cells (data not shown). Importantly, this limitation is restricted to the proliferative response and thus to Tc cycling. Recently, it was shown that persistent stimulation of the murine T cell-hybridoma 3C6 by Ag and APC lead to a reversible decrease in TCR-mediated signalling by reduced phosphorylation of TCR subunits and downstream proteins [20]. In our hands, however, the ζ-chain and p56lck has been expressed to an even higher degree in (re)stimulated preactivated versus unstimulated cells.
In response to foreign Ag, the immune system has to terminate its reaction to prevent uncontrolled clonal Tc expansion [21]. We suggest that the observations reported here are in vitro reflections of such in vivo events. The model presented shows how the same cell population can alter its functional phenotype into a non-responder state. Control of Tc expansion can, at least in part, be mediated by regulatory T cells (T-reg) which suppress T lymphocyte responsiveness mainly via CTLA-4. In fact, T-reg do express CD25. However, T-reg do not usually proliferate when subjected to IL-2 [22], while here PA Tc proliferated strongly in the presence of IL-2. Nevertheless, the population of preactivated Tc may contain significant numbers of T-reg.
Furthermore, it has been demonstrated that CD8+ Tc from HIV infected donors produce IFN-γ but not IL-2. These cells express activation markers such as HLA-DR and CD69 similar to our results, but in contrast, they lack CD25 expression and also CD3ζ chain [23].
Tc unresponsiveness has also been reported to occur in autoimmune diseases and these disorders are characterized by defects in T-reg [24,25]. It is conceivable that, at least in part, the presented data mimic such abnormalities. This aspect and the elucidation of the molecular mechanisms involved in the state of unresponsiveness will be the focus of future research.
References
- 1.Meuer SC, Hussey RE, Cantrell DA, et al. Triggering of the T3-Ti antigen receptor complex results in clonal T-cell proliferation through an interleukin 2-dependent autocrine pathway. Proc Natl Acad Sci USA. 1984;81:1509–13. doi: 10.1073/pnas.81.5.1509. [DOI] [PMC free article] [PubMed] [Google Scholar]
- 2.Leonard WJ, Kronke M, Peffer NJ, Depper JM, Greene WC. Interleukin 2 receptor gene expression in normal human T lymphocytes. Proc Natl Acad Sci USA. 1985;82:6281–5. doi: 10.1073/pnas.82.18.6281. [DOI] [PMC free article] [PubMed] [Google Scholar]
- 3.Chatila TA, Schwartz DH, Miller R, Geha RS. Requirement for mitogen, T cell-accessory cell contact, and interleukin 1 in the induction of resting T-cell proliferation. Clin Immunol Immunopathol. 1987;44:235–47. doi: 10.1016/0090-1229(87)90068-7. [DOI] [PubMed] [Google Scholar]
- 4.Cantrell DA, Collins MK, Crumpton MJ. Autocrine regulation of T-lymphocyte proliferation: differential induction of IL-2 and IL-2 receptor. Immunology. 1988;65:343–9. [PMC free article] [PubMed] [Google Scholar]
- 5.Taams LS, van Rensen AJ, Poelen MC, et al. Anergic T cells actively suppress T cell responses via the antigen-presenting cell. Eur J Immunol. 1998;28:2902–12. doi: 10.1002/(SICI)1521-4141(199809)28:09<2902::AID-IMMU2902>3.0.CO;2-B. [DOI] [PubMed] [Google Scholar]
- 6.Davis L, Vida R, Lipsky PE. Regulation of human T lymphocyte mitogenesis by antibodies to CD3. J Immunol. 1986;137:3758–67. [PubMed] [Google Scholar]
- 7.Hollsberg P, Batra V, Dressel A, Hafler DA. Induction of anergy in CD8 T cells by B cell presentation of antigen. J Immunol. 1996;157:5269–76. [PubMed] [Google Scholar]
- 8.Rellahan BL, Jones LA, Kruisbeek AM, Fry AM, Matis LA. In vivo induction of anergy in peripheral V beta 8+ T cells by staphylococcal enterotoxin B. J Exp Med. 1990;172:1091–100. doi: 10.1084/jem.172.4.1091. [DOI] [PMC free article] [PubMed] [Google Scholar]
- 9.Kyburz D, Aichele P, Speiser DE, Hengartner H, Zinkernagel RM, Pircher H. T cell immunity after a viral infection versus T cell tolerance induced by soluble viral peptides. Eur J Immunol. 1993;23:1956–62. doi: 10.1002/eji.1830230834. [DOI] [PubMed] [Google Scholar]
- 10.Koller M, Aringer M, Kiener H, et al. Expression of adhesion molecules on synovial fluid and peripheral blood monocytes in patients with inflammatory joint disease and osteoarthritis. Ann Rheum Dis. 1999;58:709–12. doi: 10.1136/ard.58.11.709. [DOI] [PMC free article] [PubMed] [Google Scholar]
- 11.Kiener HP, Hofbauer R, Tohidast-Akrad M, et al. Tumor necrosis factor alpha promotes the expression of stem cell factor in synovial fibroblasts and their capacity to induce mast cell chemotaxis. Arthritis Rheum. 2000;43:164–74. doi: 10.1002/1529-0131(200001)43:1<164::AID-ANR21>3.0.CO;2-Z. [DOI] [PubMed] [Google Scholar]
- 12.Schroder AJ, Quehl P, Muller J, Samstag Y. Conversion of p56 (lck) to p60 (lck) in human peripheral blood T lymphocytes is dependent on co-stimulation through accessory receptors: involvement of phospholipase C, protein kinase C and MAP-kinases in vivo. Eur J Immunol. 2000;30:635–43. doi: 10.1002/1521-4141(200002)30:2<635::AID-IMMU635>3.0.CO;2-H. [DOI] [PubMed] [Google Scholar]
- 13.Takahashi S, Maecker HT, Levy R. DNA fragmentation and cell death mediated by T cell antigen receptor/CD3 complex on a leukemia T cell line. Eur J Immunol. 1989;19:1911–9. doi: 10.1002/eji.1830191023. [DOI] [PubMed] [Google Scholar]
- 14.Rocha B, Tanchot C, Von Boehmer H. Clonal anergy blocks in vivo growth of mature T cells and can be reversed in the absence of antigen. J Exp Med. 1993;177:1517–21. doi: 10.1084/jem.177.5.1517. [DOI] [PMC free article] [PubMed] [Google Scholar]
- 15.De Mattia F, Chomez S, Van Laethem F, et al. Antigen-experienced T cells undergo a transient phase of unresponsiveness following optimal stimulation. J Immunol. 1999;163:5929–36. [PubMed] [Google Scholar]
- 16.Tham EL, Shrikant P, Mescher MF. Activation-induced nonresponsiveness: a Th-dependent regulatory checkpoint in the CTL response. J Immunol. 2002;168:1190–7. doi: 10.4049/jimmunol.168.3.1190. [DOI] [PubMed] [Google Scholar]
- 17.Deeths MJ, Kedl RM, Mescher MF. CD8+ T cells become nonresponsive (anergic) following activation in the presence of costimulation. J Immunol. 1999;163:102–10. [PubMed] [Google Scholar]
- 18.Tham EL, Mescher MF. Signaling alterations in activation-induced nonresponsive CD8 T cells. J Immunol. 2001;167:2040–8. doi: 10.4049/jimmunol.167.4.2040. [DOI] [PubMed] [Google Scholar]
- 19.Davis LS, Wacholtz MC, Lipsky PE. The induction of T cell unresponsiveness by rapidly modulating CD3. J Immunol. 1989;142:1084–94. [PubMed] [Google Scholar]
- 20.Lee JE, Cossoy MB, Chau LA, Singh B, Madrenas J. Inactivation of lck and loss of TCR-mediated signaling upon persistent engagement with complexes of peptide MHC molecules. J Immunol. 1997;159:61–9. [PubMed] [Google Scholar]
- 21.Sido B, Braunstein J, Breitkreutz R, Herfarth C, Meuer SC. Thiol-mediated redox regulation of intestinal lamina propria T lymphocytes. J Exp Med. 2000;192:907–12. doi: 10.1084/jem.192.6.907. [DOI] [PMC free article] [PubMed] [Google Scholar]
- 22.Shevach EM, McHugh RS, Piccirillo CA, Thornton AM. Control of T-cell activation by CD4+ CD25+ suppressor T cells. Immunol Rev. 2001;182:58–67. doi: 10.1034/j.1600-065x.2001.1820104.x. [DOI] [PubMed] [Google Scholar]
- 23.Trimble LA, Shankar P, Patterson M, Daily JP, Lieberman J. Human immunodeficiency virus-specific circulating CD8 T lymphocytes have down-modulated CD3zeta and CD28, key signaling molecules for T-cell activation. J Virol. 2000;74:7320–30. doi: 10.1128/jvi.74.16.7320-7330.2000. [DOI] [PMC free article] [PubMed] [Google Scholar]
- 24.Bermas BL, Petri M, Goldman D, et al. T helper cell dysfunction in systemic lupus erythematosus (SLE): relation to disease activity. J Clin Immunol. 1994;14:169–77. doi: 10.1007/BF01533366. [DOI] [PubMed] [Google Scholar]
- 25.Solomou EE, Juang YT, Gourlry MF, Kammer GM, Tsokos GC. Molecular basis of deficient IL-2 production in T cells from patients with systemic lupus erythematosus. J Immunol. 2001;166:4216–22. doi: 10.4049/jimmunol.166.6.4216. [DOI] [PubMed] [Google Scholar]


