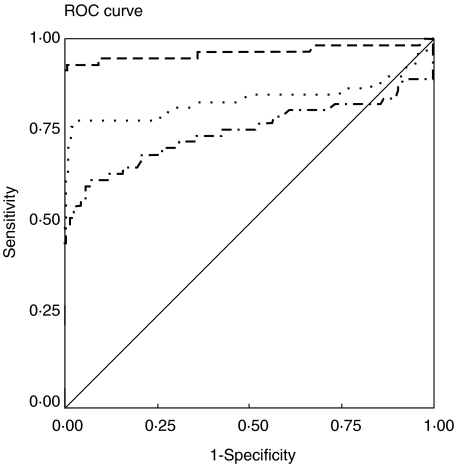
Fig. 2.
ROC curves used to determine cut-off and AUC values for HCFA and AgB tested in total IgG ELISA against sera from group I and from healthy individuals. The AgB8/2 ROC curve was included for comparison. The calculated cut-offs and AUCs are presented in Table 1. Source of the curve: —, reference line; – ––, AgB8/2; - - -, HFCA; –· − · –, AgB.

