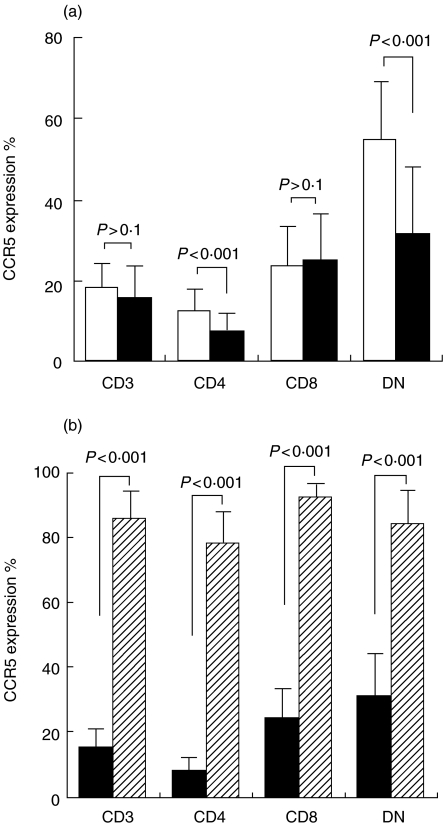
Fig. 1.
CCR5 expression percentage on peripheral CD3+ T cells, including CD4, CD8 and DN subsets in 155 RA patients and 155 healthy controls (a). CCR5 expression percentage on peripheral and synovial CD3+ T cells including CD4, CD8 and DN subsets in 30 RA patients (b). Bar heights represent mean values; brackets indicate standard deviation. (a) u, Normal; ▪, patient. (b) ▪, Peripheral blood;  , synovial fluid.

