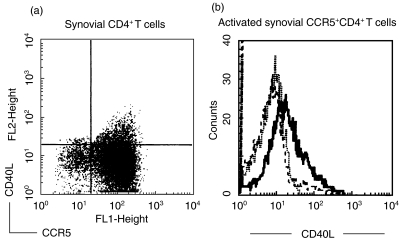
Fig. 4.
Expression of CD40L on synovial CCR5+CD4+ T cells before (a) and after (b) IL-15 (100 ng/ml) stimulation for 72 h. Triple fluorescence staining shows CCR5 on the horizontal axis (FL1), CD40L (FL2) on the vertical axis and CD4 in the FL3 axis. A representative figure is shown in (b) with expression of CD40L on the gated CCR5+ portion of purified synovial CD4+ T cells after in vitro stimulation with 100 ng/ml IL-15 (—) or medium alone (––) for 72 h. (b) ···, Staining of the isotype control MoAb.

