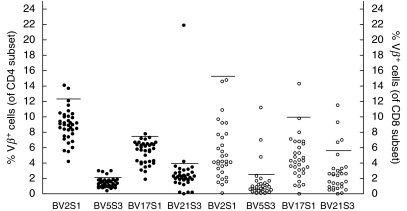
Fig. 2.
Expansions of T cell subsets expressing SAg-binding Vβ chains. Percentages of T cells expressing SAg-binding TCR Vβ chains were determined by flow cytometry. Closed symbols denote measurements in the CD4 T cell subset, open symbols denote measurements in the CD8 T cell subset. Horizontal lines represent the threshold for expansions, determined for the group of healthy controls.

