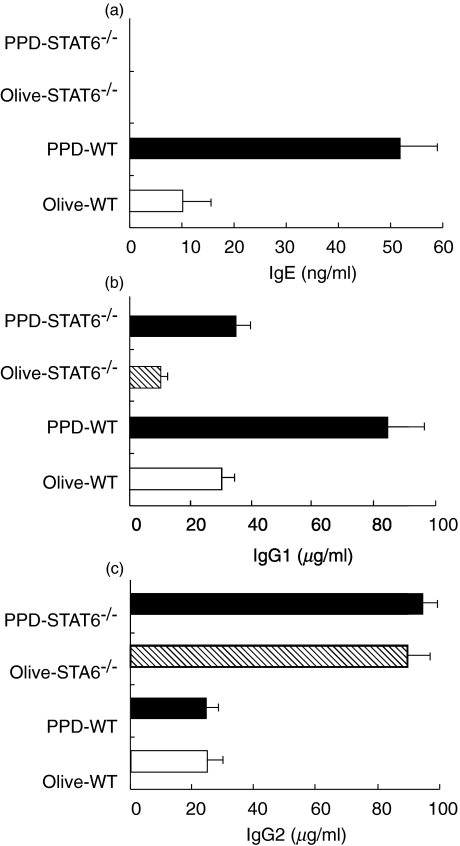
Fig. 4.
The serum IgE, IgG1, IgG2a levels of the sensitized WT and STAT6–/– mice challenged with olive oil and PPD. Mice were treated as described in the Methods. The serum IgE, IgG1, IgG2a level was analysed by ELISA. The serum (a) IgE, (b) IgG1 and (c) IgG2a levels in olive oil and PPD-challenged, sensitized WT and STAT6–/– mice. The mice were treated as described in the Methods. The serum was analysed by ELISA. The data represent the mean ± SD for groups of four mice and are representative of three independent experiments. The immunogloblin level was measured by ELISA at 24 h after the challenge. *P-value < 0·01 compared with the other groups.

