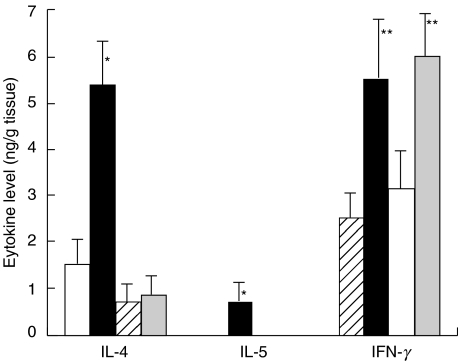
Fig. 5.
The cytokine levels in the skin tissue supernatants in the olive oil and PPD-challenged, sensitized STAT6–/– mice and WT mice. □ Olive-WT; ▪ PPD-WT;  Olive-STAT6–/–;
  PPD-STAT6–/–. The data represent the mean ± SD for groups of four mice and are representative of three independent experiments. The cytokine levels were measured by comparing them with all other groups. *P-value < 0·01 compared with the other groups, **P-value < 0·01 compared with the negative control groups.

