Fig. 4.
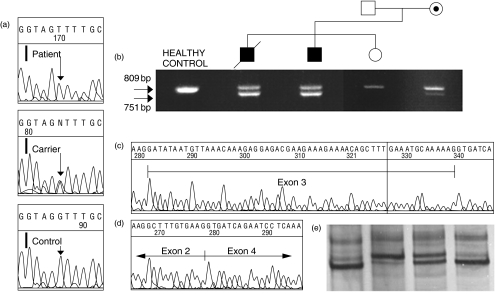
Family 1 molecular study. (a) Comparison of intron 3 sequence from the first patient, the mother and a healthy control. (b) Agarose gel showing the RT-PCR products obtained from different members. (c) Automated sequencing result obtained from the big products shown in b. (d) Exon 3 skipping in the sequence from the small band in both patients and the mother. (e) From left to right, SSCP analysis of non-carrier sister, one of the two patients, the carrier mother and a healthy control.

