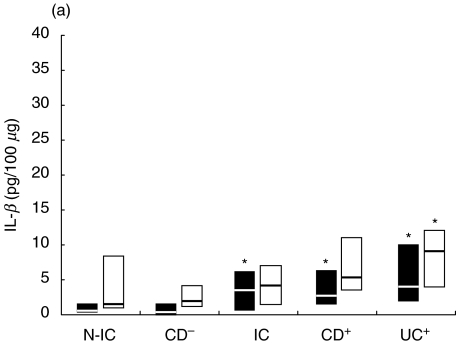
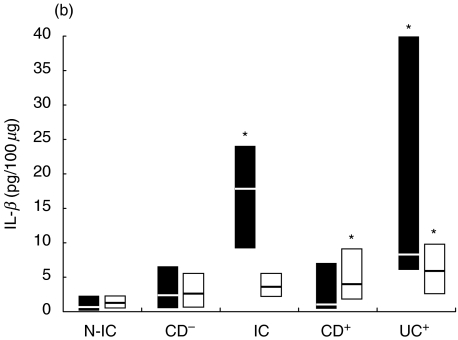
Fig. 3.
Net colonic IL-1 release in supernatants of colonic explants cultured for 18 h in the presence of (a) LPS (▪) or PWM (□) and (b) SEA (▪) or SEB (□). The box and whisker plots show the median values (horizontal lines) and first to third quartiles in boxes. Net release was calculated as described in Material and methods. *P < 0·05 versus N-IC explants stimulated with the same activator. Groups: N-IC: non-inflammatory controls; CD−: Crohn's disease with rectal tissue non-involved; IC: inflammatory controls; CD+: Crohn's disease with rectal involvement; UC+: ulcerative colitis with rectal involvement.


