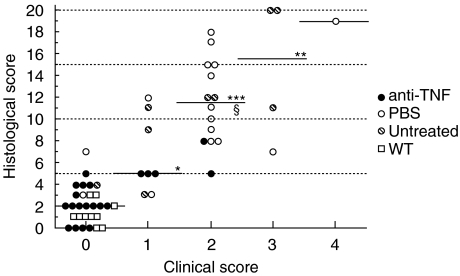
Fig. 5.
Association between clinical and histological scores in anti-TNF (•, n = 20) or PBS (○, n = 17) treated or untreated ( ), n = 9) IL-10 knockout mice and wild type (□, WT) mice (n = 10). The median is given for each group. *P < 0·005, **P < 0·002, ***P < 0·0001 when compared with those with a clinical score (CS) of 0 and §P < 0·02 when compared with those with a CS of 1. Correlation: r = 0·852, P < 0·0001.

