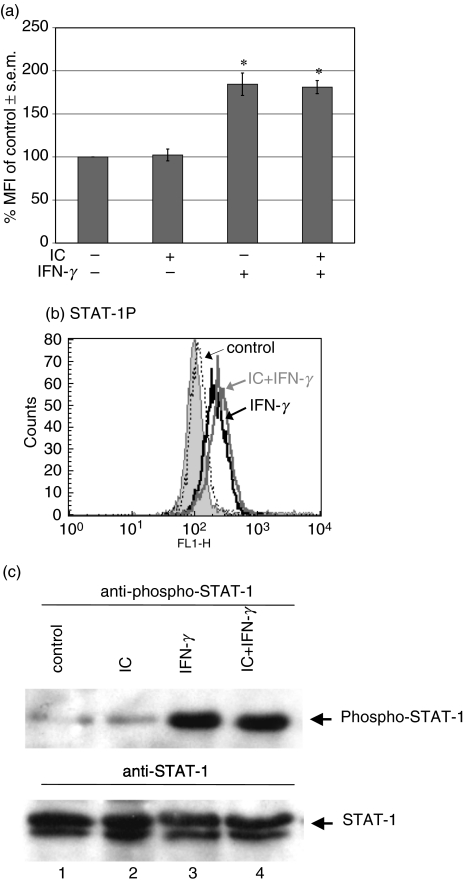
Fig. 2.
Effect of IC on phosphorylation of STAT-1. Human monocytes (2·5 × 106 cells/ml) were allowed to adhere onto γ-globulin-coated or uncoated plastic dishes for 1 h at 37°C. Then, the cells were treated with medium or IFN-γ for 15 min After that period, the cells were removed, permeabilized and the phosphorylation of STAT-1 was evaluated by flow cytometry as indicated in Materials and methods. (a) Data are expressed as % MFI ± s.e.m. of control cells. Statistical significance was calculated using the Mann–Whitney test, two-tailed; n= 5. *P < 0·05 significantly different from control. (b) The histogram corresponds to a representative experiment of five. Non-specific binding (filled peak) was determined using normal rabbit IgG as control; x axis: fluorescence intensity (arbitrary units), y axis: cell number. (c) Human monocytes (2 × 10⁶ cells/ml) were allowed to adhere onto γ-globulin-coated or uncoated plastic dishes for 1 h at 37°C. Then, the cells were treated with medium or IFN-γ for 5 min. After that period, the cells were lysed and the extracts immunoprecipitated with anti-STAT-1. They were then analysed by SDS-PAGE, transferred to PVDF membranes and probed with antiphospho-STAT-1 MoAb (upper panel). The lower panel represents the same membrane reprobed with anti-STAT-1 MoAb to show the amount of STAT-1 protein loaded in each lane. Untreated cells, lane 1; IC, lane 2; IFN-γ, lane 3; IC + IFN-γ, lane 4.

