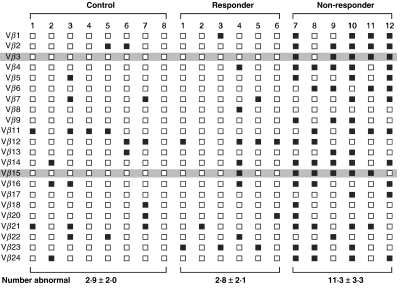
Fig. 2.
Summary of CDR3 size patterns in healthy controls (individuals 1–8) and ITP patients who had either responded (patients 1–6) or not responded (patients 7–12) to splenectomy. Open squares (□) indicate a normal CDR3 size profile, while closed squares (▪) indicate an abnormal CDR3 size profile. Shaded areas highlight subfamilies Vβ3 and Vβ15, in which CDR3 size pattern characteristics correlated with responsiveness to splenectomy in ITP patients. The mean number of abnormal CRD3 size patterns per group is given below the columns representative of each cohort.

