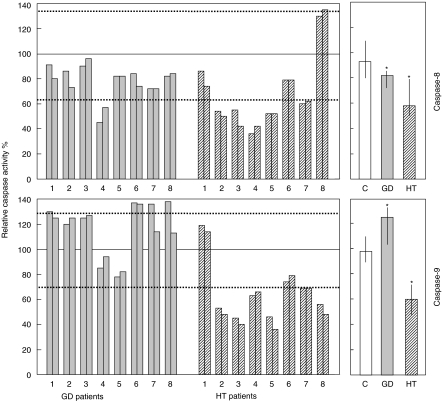
Fig. 4.
Fas-induced activation of caspase-8 (upper panels) and -9 (lower panels) in activated T cells from patients with GD, HT and normal controls. Grey bars: GD patients (n = 8); striped bars: HT patients (n = 8); white bar: normal controls (n = 16). Activated T cells were treated with anti-Fas MoAb and caspase activation was assessed after 3 h. Left panels: single patient analysis of the caspase activity evaluated in GD and HT patients (results from two independent experiments are shown for each patient); results are expressed as relative caspase activity percentage (see Materials and methods); the continuous horizontal lines indicate 100% of activity, which was the mean of the activities displayed by the two to four healthy donors run in parallel with the patient samples in each experiment; the dotted horizontal lines indicate the 95th and 5th percentile of the activity displayed by all normal controls (n = 16). Right panels: bulk caspase activity displayed by GD and HT patients and normal controls; results are expressed as median values and interquartile ranges; asterisks mark data that are significantly different from normal controls (P < 0·05, Mann–Whitney test).

