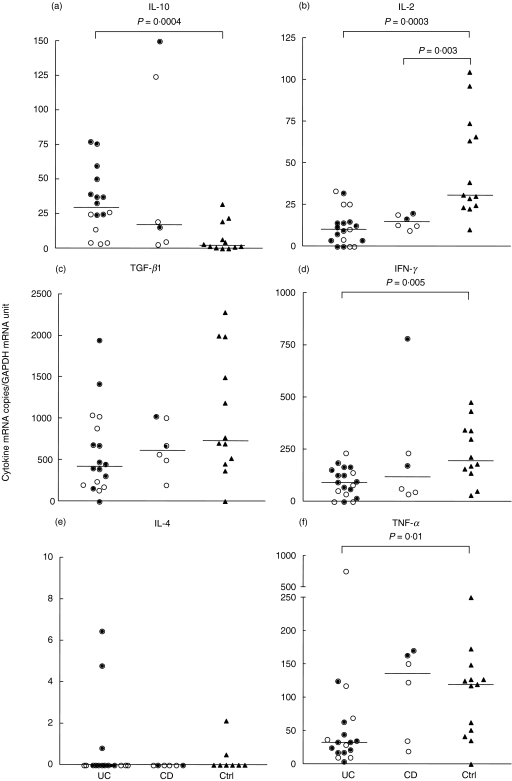
Fig. 1.
IL-10 (a), IL-2 (b), TGF-β1 (c), IFN-γ(d), IL-4 (e) and TNF-α(f) mRNA levels in freshly isolated colonic lamina propria T lymphocytes, CD3+ LPL, of ulcerative colitis patients (UC), patients with Crohn's disease (CD) and control patients (Ctrl). The amounts of cytokine mRNA and GAPDH mRNA were determined using the quantitative TaqMan EZ real time quantitative RT-PCR technology. The average level of cytokine mRNA/T cell was calculated as the ratio between the concentration of cytokine mRNA copies and GAPDH mRNA units in each sample. For the different cytokines each circle or triangle represents the value from a single subject. Filled circles indicate samples from patients with active colitis. Open circles indicate samples from patients with inactive colitis. Triangles indicate samples from controls. Horizontal bars indicate medians. Statistically significant differences with P-values ≤ 0·01 are indicated. (Mann–Whitney's ranking test).

