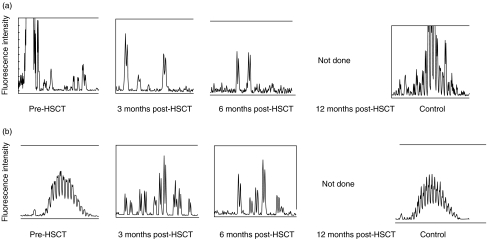
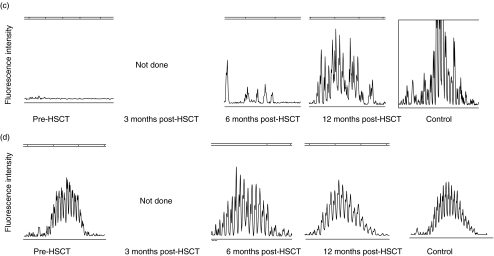
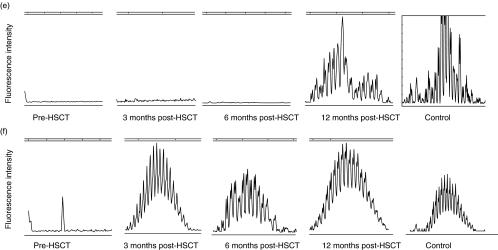
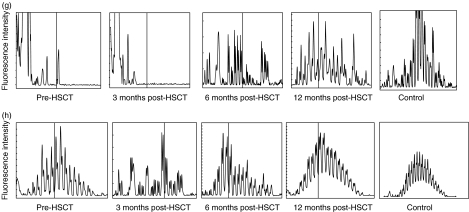
Fig. 2.
CDR3 spectratype repertoire in four representative patients compared to a normal control. Size distribution of CDR3 fragments, also called CDR3 spectratypes, in memory (upper panels) and naive (lower panels) B lymphocytes from patient 1 (A + B), patient 6 (C + D), patient 7 (E + F) and patient 8 (G + H) before HSCT and at 3, 6 and 12 months post-HSCT. The vertical line in (g) and (h) indicates 100 bp. The peaks between 75 bp and 140 bp were counted from the datasheet generated by the computerized GeneScan analysis.


