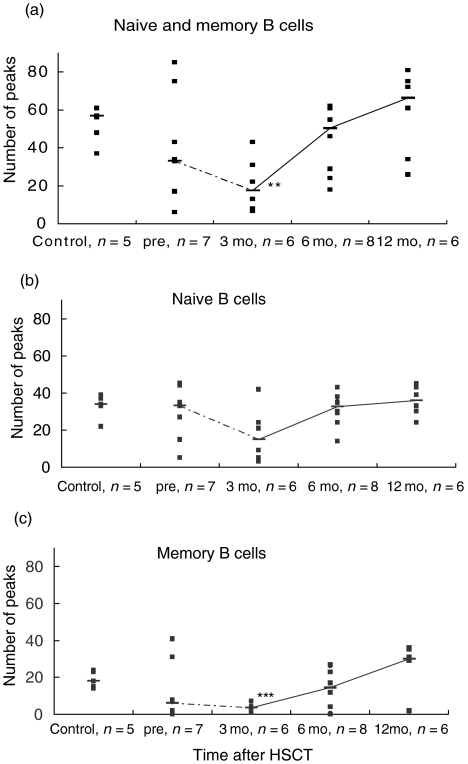
Fig. 3.
CDR3 spectratype repertoire in memory and naive B lymphocytes in patients and controls. The number of peaks in the CDR3 spectratype profile for total (a), naive (b) and memory (c) B lymphocytes for all samples are plotted (▪). The median for each group is represented by a horizontal bar and the medians are connected with a line. The number of individuals in each group is indicated under the plot. **P < 0·01, ***P < 0·001 versus healthy controls.

