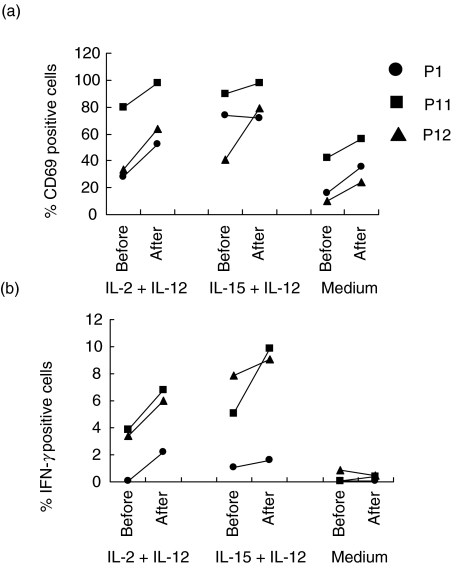
Fig. 5.
CD69 Expression and IFN-γ production at baseline and after rhGH therapy. CD69 expression (a) and IFN-γ production (b) were measured in CD3–CD56+ NK cells at baseline and after rhGH therapy. The following comparisons were made. Patient 1 (•): baseline versus week 48; patient 11 (▪): baseline versus week 24 and patient 12 (▴): baseline versus week 12. Experiments were performed on a further occasion using samples from patient 12 giving similar results.

