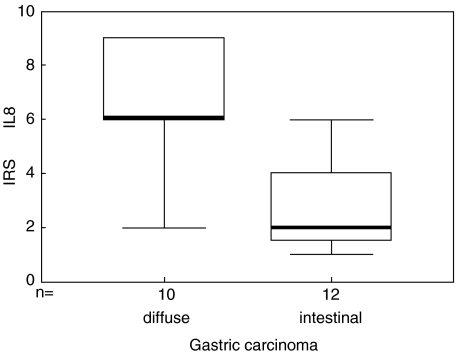
Fig. 2.
Box–Whisker plot of CXCL8 expression in gastric carcinoma. CXCL8 expression was quantified by an immunoreactive score (IRS =% CXCL8 positive tumour cells × staining intensity of CXCL8). Boxes show the ranges of 1st and 3rd quartiles, with the horizontal bars representing median values. Gastric carcinomas of the diffuse type express significantly stronger levels of CXCL8 than gastric carcinomas of the intestinal type (P < 0·01).

