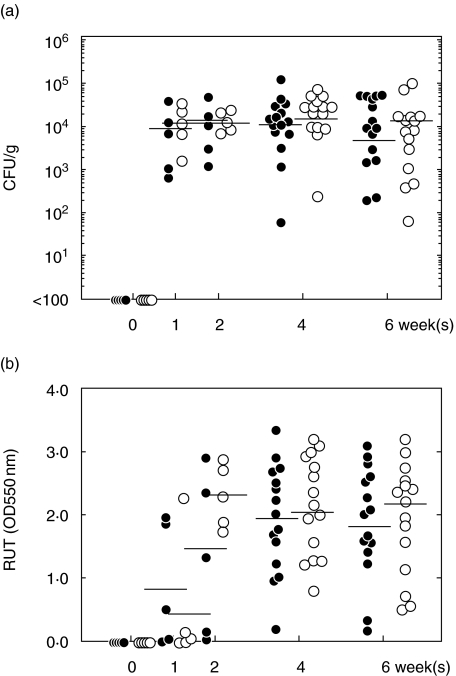
Fig. 3.
Bacterial dose (a) and urease activity (b). Closed circles: control mice; open circles: treated mice. The homogenized specimen was used for culture and for urease activity analysis. Urease activity was assessed in duplicate by measuring the absorbance at 550 nm. Data points are given in blots and a horizontal line shows the mean for each group at each point. *P < 0·05 control versus treated mice. The MoAb treatment had no significant effect on bacterial dosage and urease activity. Bacterial number reached a steady state level within the first week of infection, irrespective of treatment.

