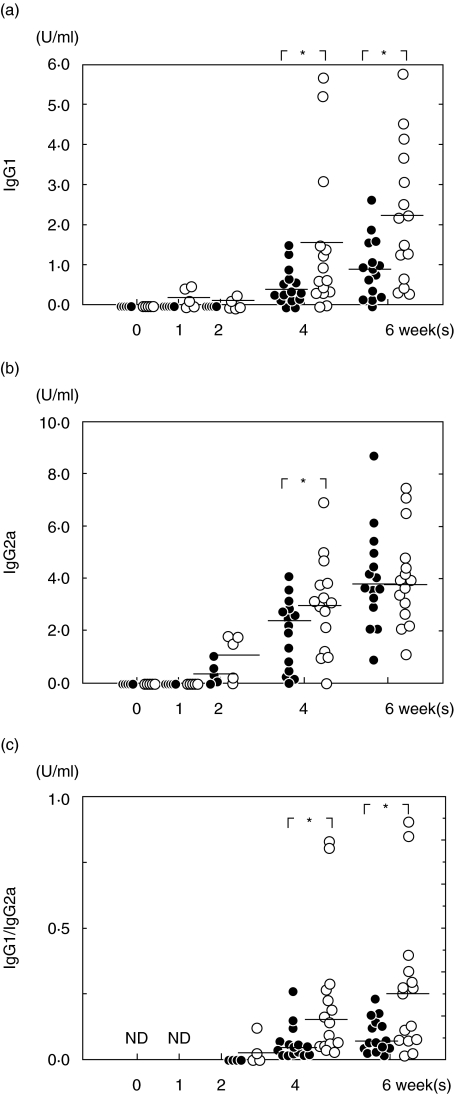
Fig. 4.
Serum levels of IgG1 (a), IgG2a (b) and the ratio of IgG1/IgG2a (c). Closed circles: control mice; open circles: treated mice. Data points are given in blots and a horizontal line shows the mean for each group at each point. *P < 0·05 control versus treated mice; ND: no data. H. pylori-specific IgG1 in treated mice increased at the first week of infection, and was then sustained significantly above those of control mice after discontinuation of treatment. The ratio of IgG1/IgG2a in treated mice was higher than that in control mice during infection.

