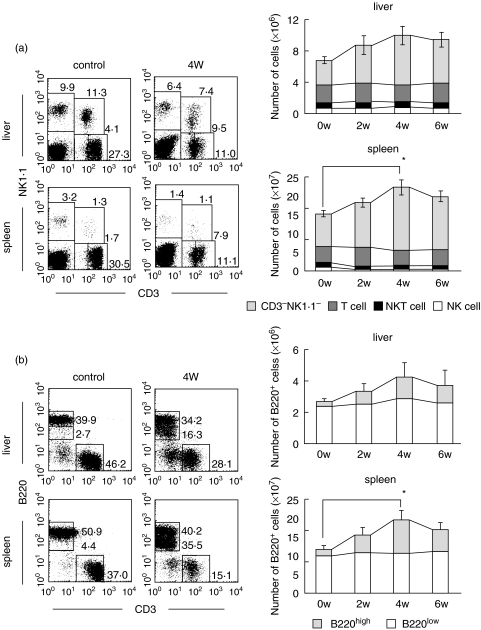
Fig. 2.
Phenotypic characterization of lymphocytes in the liver and spleen of control and amyloidosis mice. (a) Two-colour staining for CD3 and NK1·1, and time-kinetics in the variation of lymphocyte subsets. (b) Two-colour staining for CD3 and B220, and time-kinetics in the variation of lymphocyte subsets. Representative results of three experiments are depicted in the case of immunofluorescence tests. The mean and one SD in the number of lymphocyte subsets were produced from 3 mice.

