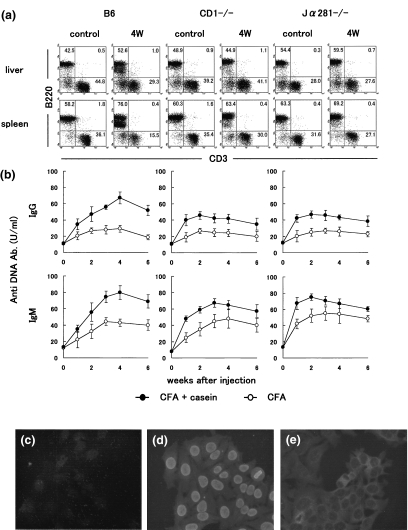
Fig. 3.
Experimental amyloidosis in NKT cell-deficient mice. (a) Two-colour staining for CD3 and B220. (b) Serum levels of the titre against anti-DNA antibody. • CFA + casein; ○ CFA (c) Immunofluorescence test of normal sera against Hep2 cells. (d) Sera from lpr mice. (e) Sera from amyloidosis mice. Numbers in the figure represent the percentages of fluorescence-positive cells in corresponding areas. The mean and one SD in serum levels of the titre against anti-DNA antibody were produced from 4 mice. Immunofluorescence test of sera was conducted using fixed Hep2 cells.

