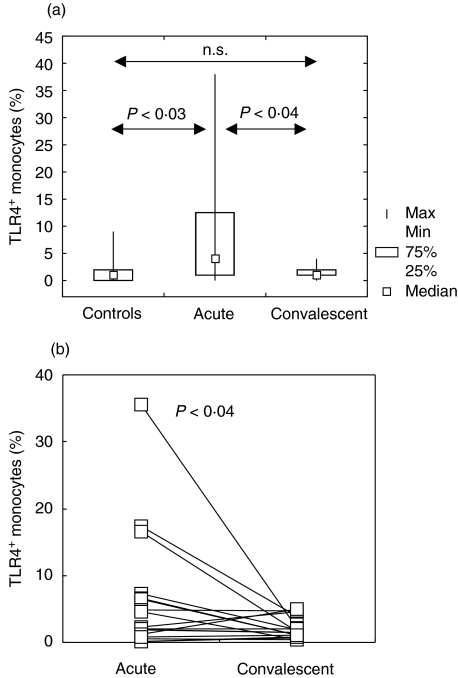
Fig. 2.
Expression of TLR4 on peripheral blood monocytes. (a) Comparison of TLR4-expressing CD14+ monocytes in acute (n = 26) and convalescent (n = 17) phases of RSV infection, and in control infants (n = 10). Box indicates 25th and 75th percentile, central point median and whiskers indicate minimum and maximum data values. Probabilities (P) of rejecting null hypothesis for computed Conover's inequalities are indicated by dotted lines are showed. n.s. = not significant. (b) Down-regulation of the percentage of TLR4-expressing CD14+ monocytes in 17 infants at weeks 4–6 of disease onset. The values obtained in a single infant in acute and convalescent phase of disease are linked with a line. Each symbol represents one tested infant.

