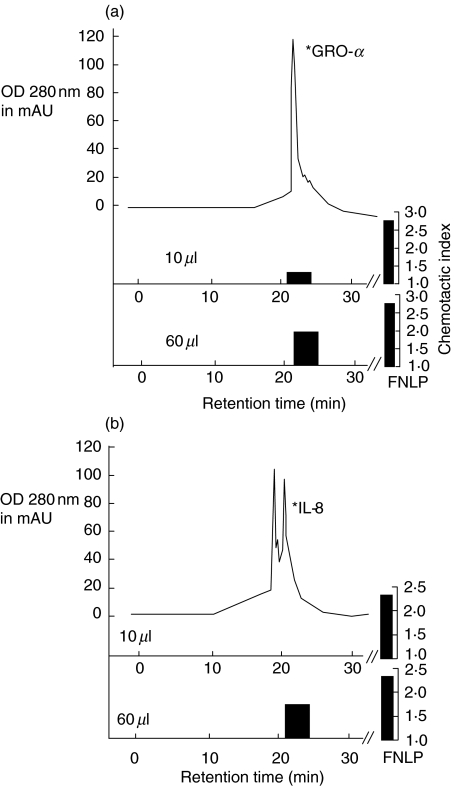
Fig. 4.
Chromatogram of microcation exchange HPLC and chemotactic index of the protein fractions from RT. Bioactive fractions from the RP-8 column were pooled into four fractions and applied to the Mono-S column. Fractions from Mono-S runs were collected automatically and again tested for chemotactic activity (10 µl and 60 µl aliquot protein fraction were collected for the Boyden chamber test). Two chromatograms are shown as examples: run number 2 in (a) and run number 3 in (b), with chemotactic indices and ELISA measurements identifying the chemokines.

