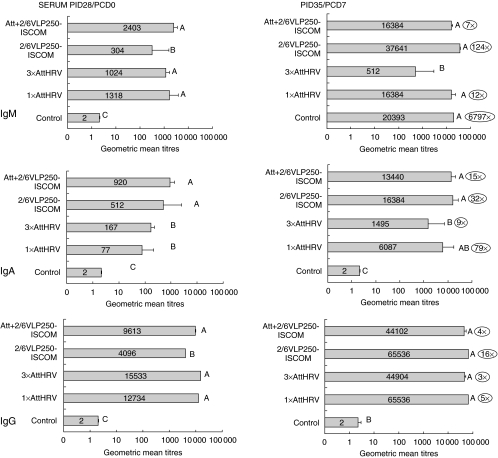
Fig. 3.
Serum IgM, IgA and IgG geometric mean antibody titres (GMT, bars) at PID 28/PCD 0 and PID 35/PCD 7 of gnotobiotic pigs receiving the various vaccination regimens. Pigs were inoculated with vaccines at PID 0, PID 10 and PID 21 and challenged at PID 28/PCD 0. Approximately half the pigs were euthanized prechallenge at PID 28 and the rest of the group was euthanized post-challenge at PID 35/PCD 7 and blood samples were collected at each of the different inoculation days. Lines represent standard error of the mean. Antibody titres that differ significantly are marked with different letters (one-way ANOVA and Duncan's multiple range test on log10-transformed titres).  Numbers to the right of the bars indicate fold increases of the PID 35/PCD 7 GMT over the PID 28/PCD 0 GMT.

