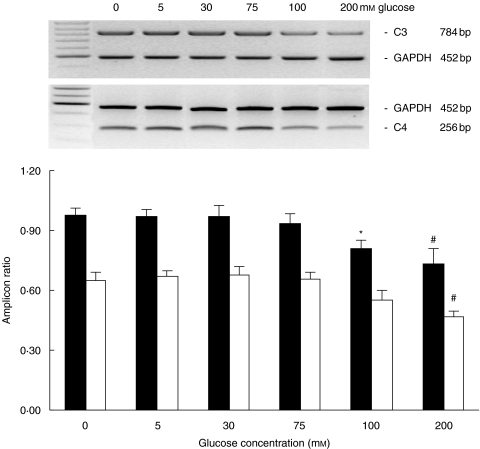
Fig. 2.
Dose effect of glucose on C3 (▪) and C4 (□) expression. Growth-arrested HPMCs in M199 media were exposed to escalating doses of glucose for 24 h. Results were obtained from triplicate experiments. A representative gel each for C3 and C4 expression in relation to GAPDH expression was shown at the top. *P = 0·018, #P = 0·001 compared to control.

