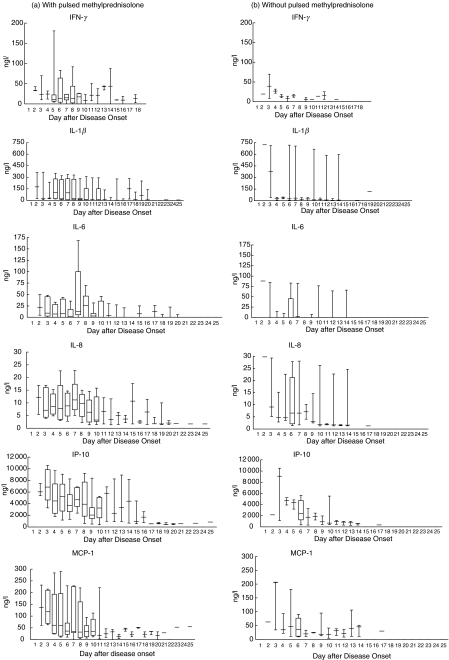
Fig. 3.
Box & whiskers plots of changes in plasma cytokine and chemokine concentrations following day of disease onset in SARS patients (a) treated (n = 13) and (b) not treated (n = 7) with pulsed methylprednisolone. Although not reaching statistical significance, median concentrations in (a) are higher than corresponding values in (b).

