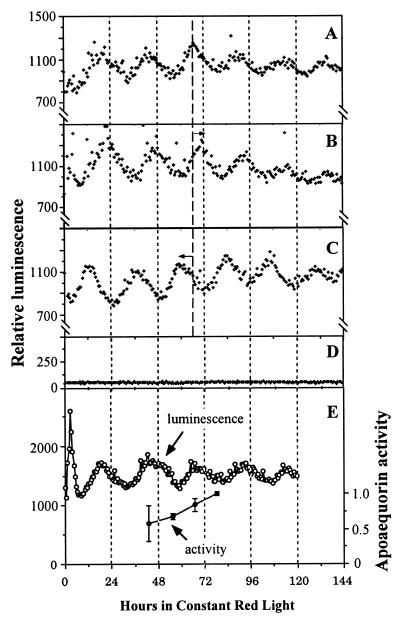
Figure 1.
Circadian oscillations of [Ca2+]c in N. tabacum monitored in the automated apparatus. (A–C) The luminescence of LAQ seedlings (six to eight seedlings per channel) in red LL (20 μE/m2⋅s) that had been incubated with coelenterazine. (A) Control (no white-light pulse). (B) One-hour white-light pulse (50 μE/m2⋅s) given at CT 13. (C) One-hour white-light pulse (50 μE/m2⋅s) given at CT 19. Before the beginning of luminescence recording, the seedlings were treated as described in Materials and Methods. Delay (B) or advance (C) phase shifts are indicated by the arrows. (D) Nontransgenic wild-type seedlings that were incubated in coelenterazine. For A–D, all treatments were done in triplicate and one representative is shown in the figure. (E) Comparison of luminescence expression of LAQ seedlings incubated in coelenterazine with total apoaequorin activity. ○, Luminescence rhythm measured as in A–D; ●, specific activity (normalized to protein concentration) of apoaequorin extracted at the indicated times from seedlings under the same conditions as the sample used for luminescence recording. Each extraction time point was done in triplicate, and error bars = SEM. The large error bar for the first data point was due to a particularly high activity in a single extract out of that triplicate.

