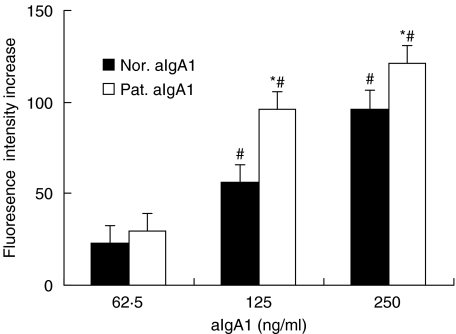
Fig. 3.
Intracellular Ca2+ increase of in HMC. The change of maximal fluorescence intensity at 525 nm recorded by Confocal microscopic on HMC before the stimulation of aIgA1 (base fluorescence) and 60 s after the addition (maximal fluorescence) of different concentration. The release of intracellular Ca2+ was expressed as the increase of maximal fluorescence intensity. Results shown were mean ± 2SE of three repeated experiments with triplicate wells. Pat.aIgA1 (patient's aIgA1). Nor. aIgA1 (normal aIgA1). The cells were a mixture of six lines and the aIgA1 sample was from pooled sera of 10 healthy controls or 10 patients. *P ≤ 0·05, Pat.aIgA1 versus Nor.aIgA1; #P ≤ 0·05, between different aIgA1 concentration.

