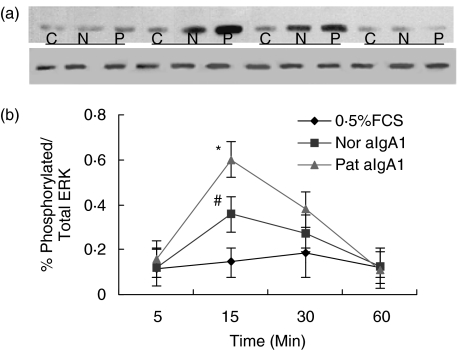
Fig. 4.
Phosphorylation of ERK in HMC. HMC were incubated in 0·5%FCS culture alone (C, 05%FCS) or with 100 µg/ml of normal aIgA1 (N, Nor.aIgA1) or patients’ aIgA1 (P, Pat. aIgA1) for different time. (a) χ film exposed using an ECL chemiluminescence kit. Upper bands were phosphorylated ERK, lower bands were total ERK (b) Densitometric analysis performed by scanning the blot of the film on scan analysis system and analysed using Imagequant. Phosphrylation of ERK was expressed as the density ratio of phosphrylated ERK over total ERK Results shown were means ± 2SE of three different experiments with triplicate wells. Pat.aIgA1 (patient's aIgA1). Nor. aIgA1 (normal aIgA1). The cells were a mixture of six lines and the aIgA1 sample was from pooled sera of 10 healthy controls or 10 patients. #P ≤ 0·05 Nor.aIgA1 versus PBS; *P ≤ 0·05 Pat.aIgA1 versus Nor.aIgA1 or P ≤ 0·01 Pat.IgA1 versus PBS.

