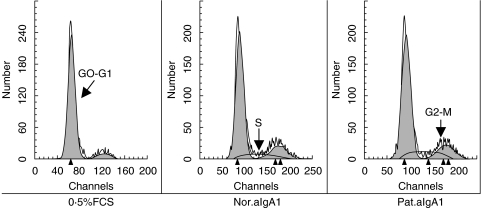
Fig. 5.
Cell cycle change of HMC£¨24 h£©. HMC, incubated for different hours in 0·5%FCS culture medium alone (0·5%FCS) or with 100 µg/ml of normal aIgA1 (Nor.aIgA1) or patients’ aIgA1 (Pat.aIgA1), were fixed and stained with Propidium iodide and RNAase at room temperature for 30 min. The stained cells were analysed on FACScan. The result was expressed as mean fluorescence intensity of HMC DNA at the incubation time of 24 h. The cells were a mixture of six lines and the aIgA1 sample was from pooled sera of 10 healthy controls or 10 patients.

