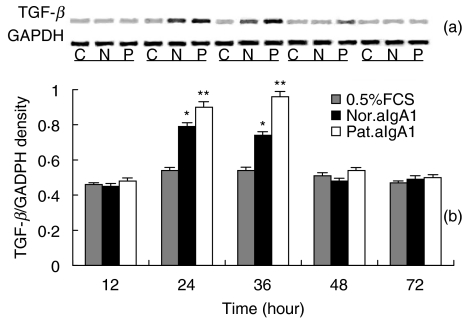
Fig. 7.
TGF-β mRNA expression in HMC. (a) Representative SDS-PAGE of RT-PCR products of mRNA isolated form serum-starved HMC exposed to 0·5%FCS culture medium alone (C, 0·5%FCS) or with aIgA1 of 100 µg/ml from healthy controls (N, Nor. aIgA1) or from patients with IgAN (P, Pat.aIgA1) for different hours. (b) Densitometric analysis of TGF-β mRNA levels, from (a), as a ratio to GAPDH. Results shown were means ± 2SE of three different experiments with triplicate wells. The cells were a mixture of six lines and the aIgA1 sample was from pooled sera of 10 healthy controls or 10 patients. *P ≤ 0·05 Nor.aIgA1 versus 0·5%FCS; **P ≤ 0·05 Pat.aIgA1 versus 0·5%FCS or Nor.aIgA1.

