Fig. 5.
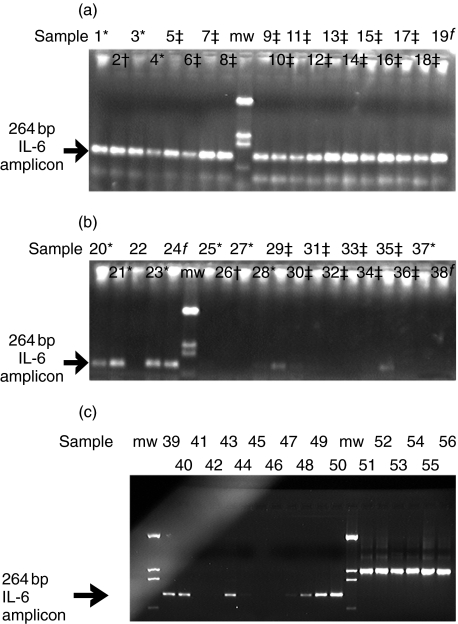
(a) Assessment of IL-6 expression in collagenase-dispersed, cultured human parathyroids by RT-PCR. RT-PCR was performed on total RNA from collagenase-dispersed, cultured human parathyroids using primers that amplified 264 bp of human IL-6. Samples 1 and 2 (ID 74 and 45, respectively, Table 1) cells collected at 24 h; samples 3 and 4 (ID 27 and 39, respectively, Table 1) cells collected at 48 h; samples 5–8 (ID 51, Table 1), cells collected 2, 6, 10 and 14 days, respectively; lane 9 = molecular weight markers (pTZ19 digested with DdeI); samples 9–11 (ID 56, Table 1), cells harvested 1, 5 and 9 days, respectively; samples 12–14 (ID 52, Table 1) three separate glands, cells harvested at 48 h; samples 15–18 (ID 58, Table 1) cells harvested at 2, 6, 10 and 12 days; sample 19 (ID 47, Table 1) cells harvested at 9 days. *Adenoma; †MEN-1; ‡secondary hyperplasia; fprimary hyperplasia.(b)Assessment of IL-6 expression in cultured or frozen operative specimens of human parathyroids by RT-PCR. RT-PCR was performed on total RNA from collagenase-dispersed, cultured (samples 20–24) or frozen, operative (samples 25–38) human parathyroids using primers that amplified 264 bp of human IL-6. Samples 20 and 21 (ID 43, Table 1) two separate glands, cells collected at 24 h; sample 22, not performed; sample 23 (ID 33, Table 1) cells collected at 24 h; sample 24 (ID 47, Table 1) cells collagenase-dispersed and not cultured, RNA prepared immediately after dispersion; lane 6 = molecular weight markers; sample 25 (ID 74, Table 1); sample 26 (ID 45, Table 1); sample 27 (ID 27, Table 1); sample 28 (ID 39, Table 1); samples 29, 30 (ID 51, Table 1), two glands; samples 31–33 (ID 56, Table 1), three glands; samples 34–36 (ID 52, Table 1), three glands, sample 37 (ID 28, Table 1), sample 38 (ID 47, Table 1). *Adenoma; †MEN-1; ‡secondary hyperplasia; fprimary hyperplasia. (c) Assessment of IL-6 expression in normal human parathyroids by RT-PCR. RT-PCR was performed on total RNA from frozen, operative normal human parathyroids using primers that amplified 264 bp of human IL-6. Sample 39 (ID 75, Table 1); sample 40 (ID 76, Table 1); sample 41(ID 77, Table 1); sample 42 (ID 78, Table 1); sample 43 (ID 79, Table 1); sample 44 (ID 80, Table 1); lanes 45–49: 10-fold serial dilutions of IL-6 transcripts corresponding to 0·1, 1, 10, 100 and 1000 copies/reaction, respectively. GAPDH control amplification was performed on the same samples, 39–43 (lanes 50–55, respectively).

