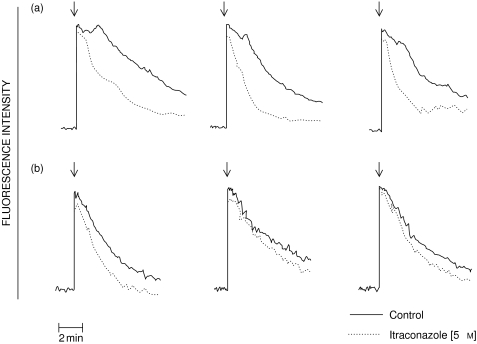
Fig. 1.
Traces from 3 experiments using neutrophils from 3 different donors showing the effects of itraconazole (5 µm) on the fura-2 fluorescence responses of cells activated with PAF (200 nm; series A) or FMLP (1 µm; series B) added as denoted by the arrow (↓). These are representative traces of 6 (FMLP) or 10 (PAF) different experiments. —– control; ------ itraconazole (5 µm).

