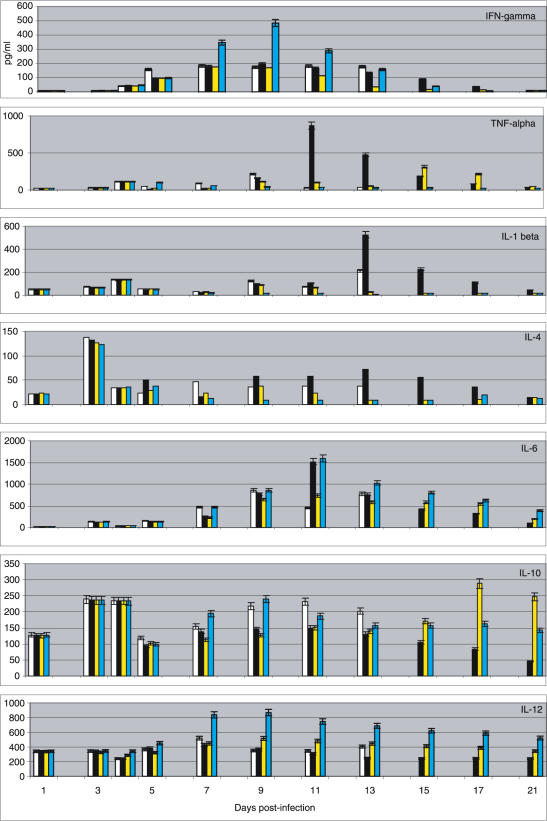
Fig. 3.
Serum levels of IFN-γ, TNF-α, IL-1β, IL-4, IL-6, IL-10 and IL-12 in BALB/c mice infected with EV, strain K-1, at a dose of 5 LD50 and treated by different schemes. x-axis: days; y-axis: concentrations in pg/ml. Day 1: EV virus inoculation. Day 4: beginning of treatment by different schemes of rmTNF-α and rmIFN-γ(see Table 1). □, control group A2;j, IFN-γ-treated group B2;  , TNF-α-treated group C2;
  , IFN-γ : TNF-α-treated group D2.

