Abstract
A number of antigens implicated in the pathogenesis of autoimmune diseases including Sjogren's syndrome and systemic lupus erythematosus (SLE) are expressed aberrantly by apoptotic cells. It is also known that apoptogenic proteins are released from the mitochondrial intermembrane space at an early stage during the induction and development of apoptosis. Combination of this evidence led us to test the hypothesis that apoptotic mechanisms provide an explanation for the abnormal expression of the inner mitochondrial enzyme, pyruvate dehydrogenase complex (PDC), observed on the surface of some cells in patients with the autoimmune liver disease primary biliary cirrhosis (PBC). Using one murine and two human cell lines it was found that the induction of apoptosis led to early detection of PDC within the cytoplasm. However, cytochrome c oxidase subunit 4 (COX 4), which is also present on the inner surface of the inner mitochondrial membrane, remained within the mitochondria. Immunoreactive PDC was also detected on the outer surface of the intact plasma membrane of cells sampled after the induction of apoptosis. Serial release of PDC to the cytoplasm and then onto the external surface of the plasma membrane provides direct evidence that the antigen on the cell surface is of mitochondrial origin. Immunoreactivity specific for PDC is strongly implicated in the pathogenesis of PBC, but this autoantigen is normally concealed from the immune system by three membrane systems. Release of PDC onto the cell surface during apoptosis provides a possible route for recognition of this antigen by the immune system which could contribute to both afferent and efferent phases of the disease process.
Keywords: apoptosis, autoantigen, autoimmunity, primary biliary cirrhosis, pyruvate dehydrogenase complex
INTRODUCTION
Understanding the mechanism of breakdown of the normal state of immune tolerance to self-antigens is central to our understanding of the pathogenesis of autoimmune disease. It has previously been reported that aberrant expression of modified forms of several nuclear autoantigens implicated in the pathogenesis of systemic lupus erythematosus (SLE) and Sjogren's syndrome occurs on the surface of cells undergoing apoptosis [1,2], and that exposure to apoptosis-modified antigens in an inflammatory environment can play a role in breakdown of immune tolerance [3–5]. These observations, when combined, raise the intriguing possibility that exposure to apoptosis-modified autoantigens may play a role in immune tolerance breakdown during the development of autoimmunity. Autoantigens which appear on the cell surface during apoptosis are known to include Ro52, Ro60 and La [6].
A further autoantigen reported to be expressed aberrantly on the surface of cells in a disease state is pyruvate dehydrogenase complex (PDC), an autoantigen implicated strongly in the pathogenesis of the autoimmune chronic liver disease primary biliary cirrhosis (PBC) [7–12]. Such expression occurs in the context of features suggestive of apoptosis, raising the possibility that the two processes may be linked [13–19].
There is, however, a major difference between the autoantigens reported to be on the cell surface during SLE and Sjogren's syndrome and the PDC observed on the surface of cells in PBC. In normal circumstances the former proteins are located exclusively within the nucleus, while mature PDC is present only on the inner surface of the inner mitochondrial membrane. As the major autoantigenic lipoylated epitopes of PDC are assembled only within the mitochondria [20], release during apoptosis might provide a mechanism which enables the immune system to contact this antigen, which is normally sequestered within three membrane systems. It is known that a range of proteins are released from the mitochondrial intermembrane space during apoptosis [21], but there have been no previous studies of the potential for molecules to cross the inner mitochondrial membrane during this process.
In this study we used a range of one murine and two human cell lines in a series of experiments to determine whether cell surface expression of PDC, of the type observed in patients with PBC, could occur as a consequence of the induction of apoptosis.
MATERIALS AND METHODS
Reagents
Pyruvate dehydrogenase complex was derived from heart muscle, as described previously [22], using a modification of the method reported by Stanley & Perham [23]. Antimitochondrial antibodies (AMA) were isolated by affinity purification of AMA-positive sera from patients with PBC (n = 6) using immobilized human pyruvate dehydrogenase complex (hPDC) purified as previously described [24].
Cell culture
The apoptosis-sensitive human Jurkat T lymphocyte cell line (J16) was kindly provided by Professor Peter Krammer, German Cancer Research, Heidelberg and grown in RPMI-1640 supplemented with 10% fetal calf serum (FCS), 100 U/ml penicillin, 100 µg/ml streptomycin and 2 mm l-glutamine (all from Sigma, Poole, UK) at 37°C in humidified air containing 5% CO2. Murine L929 cells (ECACC number 85011425) were grown in Dulbecco's minimal essential medium (DMEM) supplemented with 10% FCS and antibiotics, and human HepG2 cells (ATCC HB 8065) were grown in DMEM supplemented with non-essential amino acids, sodium pyruvate and 10% FCS; both these adherent cell lines were passaged using trypsin-EDTA (Sigma) as required.
Before analysis the Jurkat cells were centrifuged for 25 min at 400 g over Ficoll-Paque density gradient (Amersham Pharmacia Biotech, Little Chalfont, UK) and the viable cells were recovered from the interface, washed once by centrifugation at 600 g for 5 min, and resuspended in RPMI complete medium. Both adherent cell populations were washed gently to remove non-viable cells in suspension before detaching the viable cells with trypsin-EDTA. In all cases, propidium iodide (12·5 µg/ml; Sigma) was used to detect the membrane permeable, necrotic cell population which was excluded from further analysis by electronic gating. Apoptosis was induced when required by incubating cells with an optimal concentration of staurosporine (STS; 2·5 µm for Jurkat and HepG2 cells, 1·25 µm for L929 cells; Sigma) at 37°C for a minimum of 3 h. In some experiments, Jurkat cells were pretreated with the reversible caspase 3 inhibitor DEVD-CHO (10 mm; Clontech, Palo Alto, USA) for 24 h before the addition of STS.
Cell labelling for FACS analysis
For annexin V staining the cells were pelleted by centrifugation at 200 g for 5 min at room temperature, the supernatant was removed and the cell pellet resuspended in 200 µl of annexin V binding buffer (10 mm HEPES, 150 mm NaCl, 5 mm KCl, 1 mm MgCl2, 1·8 mm CaCl2) containing fluorescein isothiocyanate (FITC)-coupled annexin V (Sigma). The samples were incubated for 15 min at 37°C. Following incubation, an additional 300 µl of annexin V binding buffer was added.
For labelling with affinity-purified anti-PDC, 1 × 10⁶ Jurkat cells or 0·5 × 105 L929 or HepG2 cells were washed by resuspending in 1 ml of PBS containing 2·5% FCS, and centrifuging at 400 g for 6 min at room temperature. Cells were stained with 13 µg/ml of anti-PDC or 13 µg/ml human IgG isotype control (Sigma) and then incubated for 20 min at 4°C. Cells were then washed and stained with 50 µl antihuman IgG-FITC (Dako, Ely, UK), then left for 20 min at 4°C. Cells were washed and resuspended in 0·5 ml PBS with 2·5% FCS.
Where appropriate, the cells were permeabilized prior to labelling. Digitonin permeabilization of the plasma membrane was achieved by incubation of cells on ice in 100 µl of an optimal concentration of digitonin (100 µg/ml for Jurkat cells, 10 µg/ml for L929 or HepG2 cells; Sigma) for 20 min (Jurkat cells and L929) or 30 min (HepG2). Saponin permeabilization of all membrane systems was achieved by resuspending cells in 0·5 ml of 4% paraformaldehyde containing 0·1% saponin and incubating for 10 min at 4°C. In each case cells were washed and labelled for FACS as for unpermeabilized cells.
Analysis of caspase activity
Caspase 8 activity was assayed using the ApoAlert caspase 8 colourimetric assay kit (Clontech, Palo Alto, USA). Following the induction of apoptosis, 5 × 10⁶ Jurkat cells were centrifuged at 200 g for 5 min and the pellets were resuspended in 50 µl of chilled cell lysis buffer and incubated on ice for 10 min. Cell lysates were centrifuged at 12 000 g for 1 min. The supernatants were removed and stored at −70°C prior to subsequent assay. Total protein concentrations were determined using a bicinchoninic acid (BCA) kit (Pierce, Rockford, USA) and identical amounts of protein were used in each well of the assay (50–200µg). The assay was read at 405 nm and analysed using Revelation Quicklink Software (Dynaz Technologies, Ashford, Middlesex, UK). In some experiments caspase 8 activity was assessed following inhibition of caspase 3. Cells were preincubated with the caspase 3 inhibitor, DEVD-CHO for 24 h at a range of concentrations. As the caspase 3 inhibitor is reversible, appropriate concentrations were maintained throughout the subsequent apoptosis induction protocol.
Caspase 3 and caspase 9 activity were assessed using fluorimetric assay kits (Biorad, Hertfordshire, UK). Apoptosis was induced and the cells washed and resuspended in 1·5 ml ice-cold PBS. The cell suspensions were repelleted and the supernatant was removed. The pellets were snap-frozen in liquid nitrogen. Lysis buffer was added and the samples were freeze-thawed four times, then centrifuged at 6000 g for 5 min at 4°C. Samples were incubated with reaction buffer, and substrate at 20–37°C. The assays were read every 30 min for 3 h.
Cell fractionation of Jurkat cells
The ApoAlert cell fractionation kit (Clontech, Basingstoke, UK) was used to separate the mitochondrial fraction from the cytosolic fraction of apoptotic and non-apoptotic Jurkat cells. Apoptosis was induced by incubating cells with 2·5 µm STS at 37°C for 3 h. The location of cytochrome c in the fractions was determined by Western blot using cytochrome c antibody. The cytochrome c oxidase subunit IV (COX 4) antibody was used as a control to confirm successful separation of the mitochondrial and cytosolic fractions.
Immunoblotting
(a) Cytochrome c
The protein concentration in mitochondrial and cytosolic fractions of apoptotic and non-apoptotic Jurkat cells were determined using the BCA kit. Following denaturation by incubation at 95°C for 5 min, 10 µg of each cell fraction or 1 µg cytochrome c (Sigma) were separated by 12·5% sodium dodecyl sulphate–polyacrylamide gel electrophoresis (SDS-PAGE) and transferred to a Hybond-P nitrocellulose membrane (Amersham Pharmacia Biotech) overnight at 4°C. The membrane was blocked for 4 h with 5% non-fat dried milk in Tris-buffered saline (TBS), incubated with anticytochrome c antibody at 1 : 100 in PBS with 0·5% BSA overnight at 4°C and then incubated with antirabbit IgG-HRP (Santa Cruz, USA) at 1 : 5000 in 1% non-fat dried milk in TBS for 2 h at room temperature. The reaction was developed using ECL kit (Amersham Life Science, Little Chalfont, UK).
(b) COX 4
The cytochrome c probed membrane was stripped for 30–35 min at 50°C in 62·5 mm Tris at pH 6·7, 2% SDS and 100 mm 2-mercaptoethanol. The membrane was incubated with COX 4 antibody at 1 : 500 in PBS with 0·5% BSA overnight at 4°C, followed by incubation with antimouse IgG-HRP at 1 : 2000 (Transduction Laboratories, Oxford, UK) in 1% non-fat dried milk in TBS for 1 h at room temperature.
Confocal microscopy
Apoptotic and non-apoptotic Jurkat cells were examined in aliquots containing 1 × 10⁶ cells. Apoptosis was induced by incubating cells with 2·5 µm STS at 37°C for 18 h. All cell washes were achieved by resuspending cells in 1 ml of PBS with 2·5% FCS, centrifuging at 400 g for 6 min at room temperature. The supernatant was discarded, the cells were washed and then stained with 13 µg/ml of anti-PDC or human IgG isotype control. After 20 min at 4°C the cells were washed and stained with 50 µl of antihuman IgG-FITC and were then left for 20 min at 4°C. The cells were finally washed and resuspended in 5 µl glycerol (Sigma).
Cells were studied with a Leica TCS-SP2UV confocal laser scanning microscope (Leica Lasertechnik GmbH, Heidelberg, Germany) with Leica TCS-NT software (version 2·0). Images were acquired through a 63× oil immersion objective lens with a numerical aperture (NA) of 1·4, under a 488 nm excitation beam from argon ion laser. Z-series images were collected after optimizing the settings for the pinhole gain and offset for the photomultiplier using glow over/under in the LUT tables. Additionally, differential interference phase contrast (DIC) images were acquired using transmitted light detector along with each of the fluorescent images.
Statistical analysis
Intergroup comparisons were made using Student's unpaired t-test.
RESULTS
Before STS treatment each of the three cell types was only minimally labelled by annexin V-FITC at a concentration of 0·1 µg/ml. However, following treatment for 3 h with STS more than 80% of the Jurkat cells were positive for annexin V-FITC binding, suggesting efficient induction of apoptosis (data not shown). This approach was used to optimize the concentration of STS used to induce apoptosis in each of the cell lines.
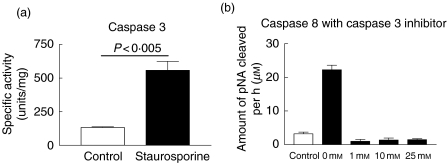
To confirm the induction of apoptosis the activities of caspase 3, 8 and 9 activity were measured in Jurkat cells incubated in the presence of 2·5 µm STS for 2 h. Activity of caspase 3 was increased significantly in STS treated apoptotic cells compared to untreated control cells (Fig. 1a). Significant increase in the activity of caspases 8 and 9 was also seen (data not shown). Caspase 8 activation was completely abrogated in the presence of caspase 3 inhibitor suggesting that STS treatment is inducing apoptosis via the intrinsic pathway (Fig. 1b).
Fig. 1.
Analysis of intracellular caspase activity. The activity of (a) caspase 3 in Jurkat cells incubated in the absence (control) and the presence of 2·5 µm STS for 2 h, and (b) caspase 8 in the presence and absence of STS and together with a increasing concentration of the caspase 3 inhibitor DEVD-CHO.
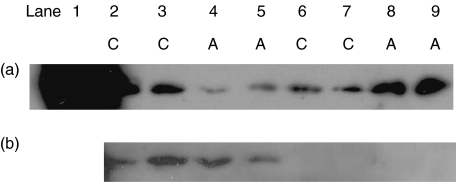
Mitochondrial and cytoplasmic fractions were prepared from non-STS treated Jurkat cells and from cells harvested 3 h after the induction of apoptosis by STS. Apoptosis was associated with a significant shift of cytochrome c from the mitochondrial to the cytoplasmic fraction, a result consistent with release of this protein from the mitochondria (Fig. 2a). When the membranes were stripped and reprobed with the anti-COX 4 antibody, reactivity was restricted to the mitochondrial fractions from both control and apoptotic cells (Fig. 2b; lanes 2–5) with no evidence of COX 4 release to the cytoplasm in either control or apoptotic cells (Fig. 2b; lanes 6–9).
Fig. 2.
Immunoblot analysis of cell fractions for cytochrome c and COX 4. Data are presented from duplicate experiments (experiment 1 lanes 2, 4, 6, 8; experiment 2 lanes 3, 5, 7, 9). (a) Mitochondrial (lanes 2–5) and cytoplasmic (lanes 6–9) fractions from non-apoptotic control cells (C; lanes 2–3 and 6–7) and apoptotic (A; lanes 4–5 and 8–9) probed with anticytochrome c antibody. The positive control lane 1 contained 1 µg cytochrome c. The membrane was subsequently stripped and (b) reprobed with anti-COX 4 antibody.
The expression pattern of PDC by apoptotic cells was studied by flow cytometry. Apoptosis was induced by incubating each cell type with STS and the expression of PDC was studied at time-points up to 18 h, 36 h and 84 h for Jurkat, L929 and HepG2 cells, respectively. Both cell surface and cytoplasmic PDC were detected by immunostaining unpermeabilized and digitonin permeabilized cells, respectively.
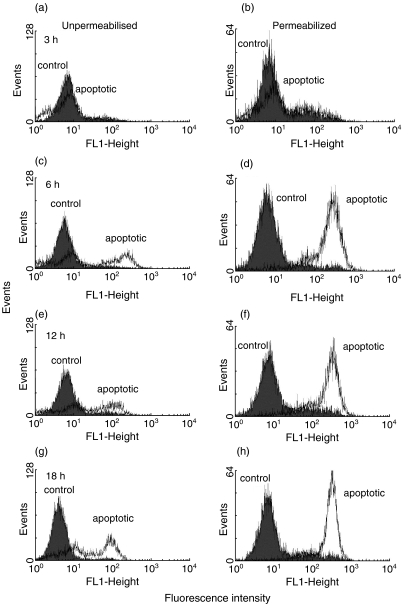
Three hours after the induction of apoptosis both unpermeabilized control and apoptotic Jurkat cells showed no staining for PDC (Fig. 3a). However, some staining of both apoptotic and control cells was seen following permeabilization of the plasma membrane with digitonin at this time-point; the presence of a small amount of PDC in the cytoplasm of control cells may reflect the synthesis of this protein or release by cells undergoing spontaneous apoptosis within the culture (Fig. 3b). Significantly increased staining for PDC was observed in permeabilized apoptotic but not control cells by 6, 12 and 18 h after the induction of apoptosis (Fig. 3d,f,h). Significantly, 6 h after the induction of apoptosis significant staining of nonpermeabilized apoptotic, but not of control cells was also seen with anti-PDC (Fig. 3c). This finding, which is strongly suggestive of cell surface expression of PDC, was also present 12 and 18 h after the induction of apoptosis (Fig. 3e,g). All control staining was negative and there was no non-specific binding of the secondary antibody.
Fig. 3.
Time course of cell surface and cytoplasmic expression of PDC following apoptosis induction. Flow cytometric analysis of anti-PDC stained Jurkat cells at 3 (a and b), 6 (c and d), 12 (e and f) and 18 (g and h) hours after the induction of apoptosis. Cells were stained in the presence (b, d, f and h) and absence (a, c, e and g) of digitonin permeabilization. Shaded histograms show control cells; open histograms show STS-treated cells.
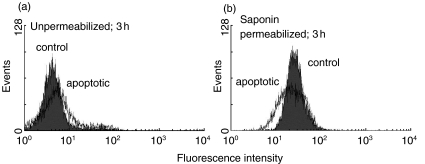
In order to study the extent to which the apparent presence of PDC in the cytoplasm of cells undergoing apoptosis could be an artefactual consequence of digitonin permeabilization of the mitochondrial membrane, FACS staining with anti-PDC was repeated in cells treated with saponin (which is able to permeabilize both the plasma and mitochondrial membranes). As before, minimal anti-PDC staining of unpermeabilized cells was seen by 3 h after the induction of apoptosis (Fig. 4a). However, in contrast to the staining pattern seen in digitonin permeabilized cells, staining of both control and apoptotic cells was seen following saponin permeabilization (Fig. 4b). The clear difference between the pattern of anti-PDC staining in digitonin and saponoin permeabilized cells suggests that digitonin is not causing mitochondrial membrane disruption under the experimental conditions used.
Fig. 4.
FACS analysis of PDC expression following saponin permeabilization. Flow cytometric analysis of anti-PDC staining of control Jurkat cells and cells 3 h following STS treatment in the (a) absence and (b) presence of saponin permeabilization. Shaded histograms show control cells and open histograms show STS-treated cells.
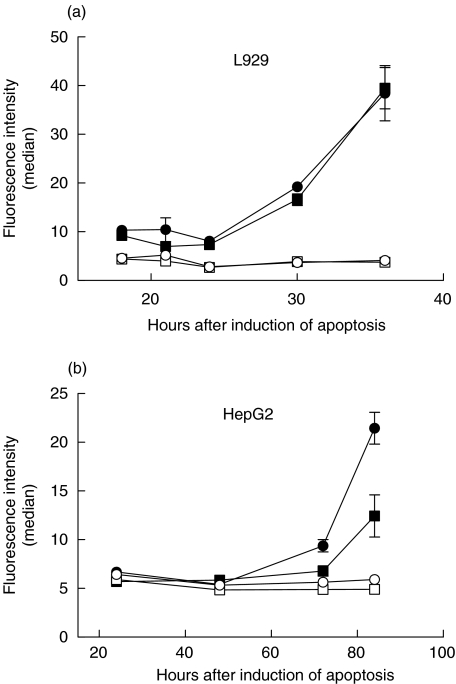
Similar experiments were performed using the adherent L929 and HepG2 cell lines. In both cases it was found that induction of apoptosis produced a significant increase in immunodetection of PDC both within the cytoplasm and on the cell surface (Fig. 5). As for Jurkat cells, viable control cultures showed no change in baseline levels of cytoplasmic or cell surface PDC. It is striking that the L929 cells showed a significant increase in PDC availability after 30 h of stimulation with STS (Fig. 5a), while over 70 h of treatment was required for the release of mitochondrial PDC from the HepG2 cells into the cytoplasm and onto the surface of unpermeabilized cells (Fig. 5b).
Fig. 5.
Time dependent expression of cytoplasmic and cell surface PDC by (a) L929 and (b) HepG2 cells after treatment with STS. In both panels circular data points show immunofluorescence labelling of digitonin permeabilized cells, while square symbols show expression by unpermeabilized cells. Solid symbols represent STS-treated cells while open symbols show control cells; the data points represent the mean of duplicate determinations; the error bars show the standard error.
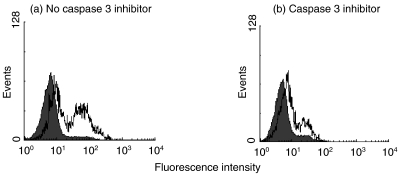
Following definition of the role played by STS-mediated apoptosis in driving redistribution of immunoreactive PDC to the plasma membrane, a further series of experiments was performed to investigate the potential contribution to this process made by active effector caspases. In this study the cell-surface immunofluorescence was compared between Jurkat cells treated with STS in the presence and absence of the DEVD-CHO inhibitor of caspase 3 (and in sequence, caspase 8). After treatment with STS for 18 h, some 54% of the intact cells expressed cell-surface immunoreactive PDC (Fig. 6a); in contrast only 21% of the cells treated with STS in the presence of the caspase 3 inhibitor showed surface expression of this protein (Fig. 6b).
Fig. 6.
Effect of the Inhibition of caspase 3 on the cell surface expression of immunoreactive PDC by STS-treated Jurkat cells. Typical flow cytometric analysis of anti-PDC stained Jurkat cells 18 h after the addition of STS. (a) Fluorescence of cells treated with STS in the absence of the caspase 3 inhibitor (54% of the cells show positive fluorescence). (b) Fluorescence of cells treated with STS in the presence of the DEVD-CHO inhibitor (21% of the cells show positive fluorescence). Shaded histograms show non-STS treated control cells; open histograms show STS-treated cells.
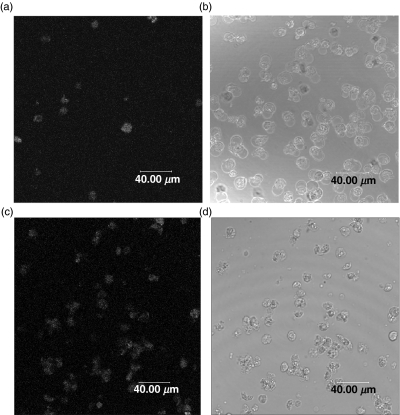
Confocal microscopy was used to obtain images following immunofluorescence detection of cell surface PDC on Jurkat cells which had been neither fixed nor permeabilized. Fewer than 10% of the non-STS-treated control cells showed fluorescence labelling (Fig. 7a); where observed, this labelling was consistent with the positive cells showing signs of morphologically defined spontaneous apoptosis (Fig. 7b). In contrast, almost all the STS-treated apoptotic cells (at 18 h following the induction of apoptosis) showed surface fluorescence staining with anti-PDC (Fig. 7c); the typical staining pattern was one of surface speckles raising the possibility of the presence of cytoplasmic blebs forming on the surface of the plasma membrane. Light microscopy showed morphology consistent with a uniform induction of apoptosis (Fig. 7d).
Fig. 7.
Confocal microscopy of anti-PDC treated cells following STS induction of apoptosis. (a) and (b) show paired immunofluorescence and phase contrast images of unpermeabilized control Jurkat cells, while (c) and (d) show paired images of unpermeabilized cells after treatment with STS for 18 h. Few of the control cells show cell surface PDC expression (consistent with spontaneous apoptosis) while the majority of STS treated cells show the presence of this antigen on the cell surface.
DISCUSSION
This study was designed to examine the potential role played by apoptosis in alteration of cell surface expression of the mitochondrial autoantigen PDC. Previous studies performed both in vitro and in vivo have demonstrated the appearance during PBC of an antigen on the surface of disease-specific target cells, such as intrahepatic biliary epithelial cells, which is cross-reactive with anti-PDC antibodies [8,9,11,25]. The mechanism for this aberrant autoantigen expression has remained unclear, although infection by a betaretrovirus has recently been implicated [26].
Three indicator cell lines, two human and one murine, were investigated during this study to determine whether the induction of apoptosis could provide a general mechanism for the release of immunoreactive PDC from the inner mitochondrial space onto the cell surface. These cell lines were all induced to undergo apoptosis by treatment with staurosporine; this broad spectrum protein kinase inhibitor has been used widely to elicit prototypical apoptosis of many cell types, including primary cholangiocytes from normal liver [27]. Approaches used to examine the apoptotic process included annexin V binding, measurement of the release of cytochrome c from the mitochondrial intermembrane space and demonstration of the activation of apoptogenic caspase 9, 3 and 8. Importantly, PBC patient-derived anti-PDC antibodies were used in these experiments to detect extra-mitochondrial PDC in order to demonstrate the potential of aberrantly expressed PDC to play a role in the pathogenesis of this disease.
An important observation from the study was that healthy cells showed no significant expression of immunoreactive PDC in their cytoplasm or on their cell surface. However, this antigen was detected at both of these sites following the induction of apoptosis. Importantly, the kinetics for the appearance of this antigen were variable between the three cell types studied, potentially reflecting variability in the cells resistance to apoptosis. However, in each case, immunoreactivity consistent with the expression of PDC was detected on the surface of intact plasma membranes following the induction of apoptosis. Study of viable control cells following treatment with agents which differentially permeabilize either the plasma membrane or all the membrane systems suggested that this immunoreactive PDC was released first from the mitochondria into the cytoplasm and then onto the cell surface. This pathway is consistent with the fluorescence images of viable and apoptotic cells which show the presence of PDC in punctate deposits on the surface of most of the condensed apoptotic cells. By contrast, fewer than 10% of the control cells showed cell-surface staining with anti-PDC. Those control cells which showed positive staining also had morphology consistent with spontaneous apoptosis in the culture. Importantly, this observation suggests that the release of immunoreactive PDC is not an artefact associated with STS-induced apoptosis but also occurs physiologically during spontaneous apoptosis.
Observations made during the current study contrast with those of Odin et al. who used results from Western blotting to argue that immunoreactive PDC is not released from the mitochondria of a range of cells after the induction of apoptosis [27]. This apparent disparity may be explained by the different techniques used in these two studies. Western blotting produces an average picture of protein expression by an entire cell population while immunofluorescence flow cytometry allows extremely sensitive detection of fluorescence signals associated with individual cells. On this basis, it can be argued that the flow cytometric method employed in the current study was superior as it permitted direct evaluation of PDC expression within the relatively small number of positive cells which occur at early times during the apoptotic process. Furthermore, selective cell permeabilization allowed discrimination between total, cytoplasmic and extracellular expression of immunoreactive PDC in individual cells. This provided a system for longitudinal monitoring of the release of this protein from mitochondria into the cytoplasm and then onto the external surface of the intact plasma membrane during apoptosis. Odin et al. also demonstrated variable expression of immunoreactive PDC within individual permeabilized cells using fluorescence microscopy at fixed times after the induction of apoptosis [27]. However, results from this study are not comparable with those obtained by sensitive confocal microscopy of viable and apoptotic cells in the current study, as permeabilization allows only a measure of the total expression of immunoreactive PDC by each cell in a mixed population of apoptotic and non-apoptotic cells while our study demonstrated the presence of protein on the external surface of the plasma membrane.
As PDC is synthesized in the cytoplasm before being imported to the mitochondria, it is reasonable to expect that this antigen should be detected in the cytoplasm of normal cells. However, efficient mitochondrial import maintains only a low concentration of precursor PDC components within the cytoplasm [28] and, importantly, the lipoic acid-containing immunodominant epitope on PDC is only assembled once the subunit proteins have entered the mitochondrial matrix [20]. As most of the patient derived anti-PDC antibodies are specific for this epitope, the observation of efficient labelling of cell surface proteins provides further evidence that lipoylated protein from the mitochondrial compartment are exported during apoptosis.
The release of mitochondrial proteins is a well-established phenomenon which plays a central role in the regulation of apoptosis [29]. Indeed, a range of apoptogenic proteins including cytochrome c, certain pro-caspases, Smac/DIABLO, HtrA2/Omi, AIF and Endo G are known to be released into the cytoplasm from the mitochondrial intermembrane space [21]. The early release of mitochondrial cytochrome c is shown clearly in results from the current study. Within the cytoplasm this protein binds to the adaptor proteins Apaf-1 and pro-caspase 9 to form the apoptosome resulting in activation of caspase 9 which, in turn, activates downstream caspases including terminal effectors such as caspases 3 and 8; the sequential course of this process is demonstrated in the current study indicating the functional significance of cytochrome c release during STS-induced apoptosis of the indicator cell line. It is significant that inhibition of the activity of caspase 3 (and, ultimately, caspase 8) reduced the cell-surface expression of immunoreactive PDC by staurosporine-treated Jurkat cells, suggesting that activation of these effector casapses is involved in amplification of the release of PDC from the inner mitochondrial compartment.
The mechanism by which proteins are released from the mitochondrial intermembrane space has not been defined. However, recent mass spectroscopic studies suggest that all soluble intermembrane proteins are released through the permeabilized outer mitochondrial membrane following the induction of apoptosis [30]. Although apoptosis is associated with assembly of the permeability transition pore and collapse of the transmembrane potential difference across the inner mitochondrial membrane, current evidence suggests that permeabilization of this membrane remains partial, with matrix proteins, including the intrinsic membrane protein COX 4, remaining within the inner mitochondrial space [21]. The most significant observation made in the current study is that PDC, a protein loosely associated with the inner surface of the inner mitochondrial membrane [31], is also released into the cytoplasm after the initiation of apoptosis and is subsequently expressed on the external surface of the intact plasma membrane.
It is possible that PDC release into the cytoplasm could be a non-specific, late-stage phenomenon resulting from terminal disruption of all mitochondrial membranes. However, the absence of detectable COX 4 in the cytoplasm at a time in Jurkat cells when cytoplasmic PDC expression was increasing suggests that the process is, at least to some extent, specific for the release of PDC. This may indicate the existence of a channel-dependent mechanism, possibly analogous to the permeability transition pore [32–34], but the size of the multi-enzyme PDC (> 4 MDa) imposes severe physical constraints on any such pore. An alternative explanation for this apparent specificity is that PDC is only loosely associated with the membrane, while COX 4 is intrinsic and its release would require more complete disruption of the structure of inner membrane.
It is possible that the increase in PDC observed in the cytoplasm prior to its surface expression results not from its release from the mitochondria but from increased synthesis. The components of PDC are encoded by nuclear DNA and are normally transported to, and taken up rapidly by the mitochondria following translation. It has recently been reported that increased transcription of a number of nuclear encoded, mitochondrially expressed, metabolic enzymes (including cytochrome c and COX 2) occurs rapidly after the induction of apoptosis, suggesting that metabolic function is important for the process of apoptosis [35]. While this process might contribute to the increased expression of cytoplasmic PDC, this form of the protein lacks the dominant autoantigenic lipoylated epitope [20]. Furthermore, it remains clear that apoptosis does provide a mechanism for the redistribution of immunoreactive PDC to the external surface of the plasma membrane.
It is interesting to speculate about the implications for PBC of the export of autoantigenic PDC from the inner mitochondrial compartment, where it is concealed from the immune system by 3 membrane systems, to the external surface of the plasma membrane [7]. While the consequences of this redistribution are not known, it is possible that the plasma membrane-expressed protein will be bound by cross-reactive anti-PDC antibodies which are produced during some infections [36]. This opsonization could enhance antigen uptake by phagocytic antigen-presenting cells leading to an increased possibility for presentation to autoreactive T cells; animal model studies performed by our group have already demonstrated a clear role for cross-reactive anti-PDC antibodies during the breakdown of T cell tolerance to self PDC [37]. Localization of these processes within the liver might provide a mechanism for the tissue specificity of the autoimmune disease process characteristic of PBC.
References
- 1.Casciola-Rosen LA, Anhalt G, Rosen A. Autoantigens targeted in systemic lupus erythematosus are clustered in two populations of surface blebs on cultured keratinocytes. J Exp Med. 1994;179:1317–30. doi: 10.1084/jem.179.4.1317. [DOI] [PMC free article] [PubMed] [Google Scholar]
- 2.Sapozhnikov AM, Gusarova GA, Ponomarev ED, et al. Translocation of cytoplasmic HSP70 onto the surface of EL-4 cells duting apoptosis. Cell Prolif. 2002;35:193–206. doi: 10.1046/j.1365-2184.2002.00239.x. [DOI] [PMC free article] [PubMed] [Google Scholar]
- 3.Andrade F, Casciola-Rosen L, Rosen A. Apoptosis in systemic lupus erythematosis. Clinical implications. Rheum Dis Clin North Am. 2000;26:215–27. doi: 10.1016/s0889-857x(05)70136-8. [DOI] [PubMed] [Google Scholar]
- 4.Gensler TJ, Hottelet M, Zhang C, et al. Monoclonal antibodies derived from BALB/c mice immunized with apoptotic Jurkat T cells recognize known autoantigens. J Autoimmun. 2001;16:59–69. doi: 10.1006/jaut.2000.0464. [DOI] [PubMed] [Google Scholar]
- 5.Saegusa K, Ishimura N, Yanagi K, et al. Prevention and induction of autoimmune exocrinopathy is dependent on pathogenic autoantigen cleavage in murine Sjogren's syndrome. J Immunol. 2002;169:1050–7. doi: 10.4049/jimmunol.169.2.1050. [DOI] [PubMed] [Google Scholar]
- 6.Ohlsson M, Jonsson R, Brokstad KA. Subcellular redistribution and surface expression of the Ro52, Ro60 and La48 autoantigens during apoptosis in human ductal epithelial cells: a possible mechanism in the pathogenesis of Sjogren's syndrome. Scand J Immunol. 2002;56:456–69. doi: 10.1046/j.1365-3083.2002.01072_79.x. [DOI] [PubMed] [Google Scholar]
- 7.Palmer JM, Kirby JA, Jones DEJ. The immunology of primary biliary cirrhosis: the end of the beginning? Clin Exp Immunol. 2002;129:191–7. doi: 10.1046/j.1365-2249.2002.01948.x. [DOI] [PMC free article] [PubMed] [Google Scholar]
- 8.Joplin R, Gershwin ME. Ductular expression of autoantigens in primary biliary cirrhosis. Semin Liver Dis. 1997;17:97–103. doi: 10.1055/s-2007-1007187. [DOI] [PubMed] [Google Scholar]
- 9.Joplin R, Gordon L, Lindsay J, et al. Membrane dihydrolipoamide acetyltransferase (E2) on human biliary epithelial cells in primary biliary cirrhosis. Lancet. 1992;339:93–4. doi: 10.1016/0140-6736(92)91001-o. [DOI] [PubMed] [Google Scholar]
- 10.Joplin R, Wallace LL, Johnson GD, et al. Subcellular localization of pyruvate dehydrogenase dihydrolipoamide acetyltransferase in human intrahepatic biliary epithelial cells. J Pathol. 1995;176:381–90. doi: 10.1002/path.1711760409. [DOI] [PubMed] [Google Scholar]
- 11.Nakanuma Y, Tsuneyama K, Kono N, et al. Biliary epithelial expression of pyruvate dehydrogenase complex in primary biliary cirrhosis: an immunohistochemical and immunoelectron microscopic study. Hum Pathol. 1995;26:92–8. doi: 10.1016/0046-8177(95)90120-5. [DOI] [PubMed] [Google Scholar]
- 12.Tsuneyama K, Van de Water J, Leung PS, et al. Abnormal expression of the E2 component of the pyruvate dehydrogenase complex on the luminal surface of biliary epithelium occurs before major histocompatability complex class II and BB1/B7 expression. Hepatology. 1995;21:1031–7. [PubMed] [Google Scholar]
- 13.Fox CK, Furtwaengler A, Nepomuceno RR, et al. Apoptotic pathways in primary biliary cirrhosis and autoimmune hepatitis. Liver. 2001;21:272–9. doi: 10.1034/j.1600-0676.2001.021004272.x. [DOI] [PubMed] [Google Scholar]
- 14.Graham AM, Dollinger MM, Howie SE, et al. Bile duct cells in primary biliary cirrhosis are ‘primed’ for apoptosis. Eur J Gastroenterol Hepatol. 1998;10:540–1. doi: 10.1097/00042737-199807000-00005. [DOI] [PubMed] [Google Scholar]
- 15.Harada K, Ozaki S, Gershwin ME, et al. Enhanced apoptosis relates to bile duct loss in primary biliary cirrhosis. Hepatology. 1997;26:1399–405. doi: 10.1002/hep.510260604. [DOI] [PubMed] [Google Scholar]
- 16.Iwata M, Harada K, Hiramatsu K, et al. Fas ligand expressing mononuclear cells around intrahepatic bile ducts co-express CD68 in primary biliary cirrhosis. Liver. 2000;21:129–35. doi: 10.1034/j.1600-0676.2000.020002129.x. [DOI] [PubMed] [Google Scholar]
- 17.Iwata M, Harada K, Kono N, et al. Expression of Bcl-2 familial proteins is reduced in small bile duct lesions of primary biliary cirrhosis. Hum Pathol. 2000;31:179–84. doi: 10.1016/s0046-8177(00)80217-8. [DOI] [PubMed] [Google Scholar]
- 18.Koga H, Sakisaka S, Ohishi M, et al. Nuclear DNA fragmentation and expression of Bcl-2 in primary biliary cirrhosis. Hepatology. 1997;25:1077–84. doi: 10.1002/hep.510250505. [DOI] [PubMed] [Google Scholar]
- 19.Kuroki T, Seki S, Kawakita N, et al. Expression of antigens related to apoptosis and cell proliferation in chronic nonsuppurative destructive cholangitis in primary biliary cirrhosis. Virchows Arch. 1996;429:119–29. doi: 10.1007/BF00192434. [DOI] [PubMed] [Google Scholar]
- 20.Yeaman SJ, Fussey SP, Danner DJ, et al. Primary biliary cirrhosis: identification of two major M2 mitochondrial autoantigens. Lancet. 1988;i:1067–70. doi: 10.1016/s0140-6736(88)91894-6. [DOI] [PubMed] [Google Scholar]
- 21.Ravagnan L, Roumier T, Kroemer G. Mitochondria, the killer organelles and their weapons. J Cell Physiol. 2002;192:131–7. doi: 10.1002/jcp.10111. [DOI] [PubMed] [Google Scholar]
- 22.Jones DEJ, Palmer JM, Yeaman SJ, et al. T-cell responses to the components of pyruvate dehydrogenase complex in primary biliary cirrhosis. Hepatology. 1995;21:995–1002. [PubMed] [Google Scholar]
- 23.Stanley CJ, Perham RN. Purification of the 2-oxo acid dehydrogenase complexes from ox heart by a new method. Biochem J. 1980;191:147–54. doi: 10.1042/bj1910147. [DOI] [PMC free article] [PubMed] [Google Scholar]
- 24.Palmer JM, Bassendine MF, James OFW, et al. Human pyruvate dehydrogenase complex as an autoantigen in primary biliary cirrhosis. Clin Sci. 1993;85:289–93. doi: 10.1042/cs0850289. [DOI] [PubMed] [Google Scholar]
- 25.Joplin R, Johnson GD, Matthews JB, et al. Distribution of pyruvate dehydrogenase dihydrolipoamide acetyltransferase (PDC-E2) and another mitochondrial marker in salivary gland and biliary epithelium from patients with primary biliary cirrhosis. Hepatology. 1994;19:1375–80. [PubMed] [Google Scholar]
- 26.Xu L, Shen S, Guo L, et al. Does a betaretrovirus infection trigger primary biliary cirrhosis? Proc Natl Acad Sci USA. 2003;100:8454–9. doi: 10.1073/pnas.1433063100. [DOI] [PMC free article] [PubMed] [Google Scholar]
- 27.Odin JA, Huebert RC, Casciola-Rosen L, et al. Bcl-2-dependent oxidation of pyruvate dehydrogenase-E2, a primary biliary cirrhosis autoantigen, during apoptosis. J Clin Invest. 2001;108:223–32. doi: 10.1172/JCI10716. [DOI] [PMC free article] [PubMed] [Google Scholar]
- 28.Glover LA, Lindsay JG. Targeting proteins to mitochondria: a current overview. Biochem J. 1992;284(3):609–20. doi: 10.1042/bj2840609. [DOI] [PMC free article] [PubMed] [Google Scholar]
- 29.Springs S, Diavolitsis VM, Goodhouse J, et al. The kinetics of translocation of Smac/DIABLO from the mitochondria to the cytosol in HeLa cells. J Biol Chem. 2002;277:45715–8. doi: 10.1074/jbc.C200524200. [DOI] [PubMed] [Google Scholar]
- 30.Van Loo G, Demol H, van Gurp M, et al. A matrix-assisted laser desorption ionization post-source decay (MALDI-PSD) analysis of proteins released from isolated liver mitochondria treated with recombinant truncated Bid. Cell Death Diff. 2002;9:301–8. doi: 10.1038/sj.cdd.4400966. [DOI] [PubMed] [Google Scholar]
- 31.Yeaman SJ, Kirby JA, Jones DEJ. Autoreactive responses to pyruvate dehydrogenase complex in the pathogenesis of primary biliary cirrhosis. Immunol Rev. 2000;174:238–49. doi: 10.1034/j.1600-0528.2002.00021h.x. [DOI] [PubMed] [Google Scholar]
- 32.Degterev A, Boyce M, Yuan J. The channel of death. J Cell Biol. 2001;155:695–7. doi: 10.1083/jcb.200110147. [DOI] [PMC free article] [PubMed] [Google Scholar]
- 33.Shimizu S, Ide T, Yanagida T, et al. Electrophysiological study of a novel pore formed by Bax and the voltage-dependent anion channel that is permeable to cytochrome c. J Biol Chem. 2000;275:12321–5. doi: 10.1074/jbc.275.16.12321. [DOI] [PubMed] [Google Scholar]
- 34.Wei MC, Zong WX, Cheng EH, et al. Proapoptotic BAX and BAK. A prerequisite gateway to mitochondrial dysfunction and death. Science. 2001;292:727–30. doi: 10.1126/science.1059108. [DOI] [PMC free article] [PubMed] [Google Scholar]
- 35.Chandra D, Liu J-W, Tang D. Early mitochondrial activation and cytochrome c up-regulation during apoptosis. J Biol Chem. 2002;277:50842–54. doi: 10.1074/jbc.M207622200. [DOI] [PubMed] [Google Scholar]
- 36.Klein R, Wiebel M, Engelhart S, et al. Sera from patients with tuberculosis recognise the M2a-epitope (E2-subunit of pyruvate dehydrogenase complex) specific for primary biliary cirrhosis. Clin Exp Immunol. 1993;92:308–16. doi: 10.1111/j.1365-2249.1993.tb03397.x. [DOI] [PMC free article] [PubMed] [Google Scholar]
- 37.Jones DEJ, Palmer JM, Bennett K, et al. Investigation of a mechanism for accelerated breakdown of immune-tolerance to the primary biliary cirrhosis associated autoantigen, pyruvate dehydrogenase complex. Lab Invest. 2002;82:211–9. doi: 10.1038/labinvest.3780413. [DOI] [PubMed] [Google Scholar]


