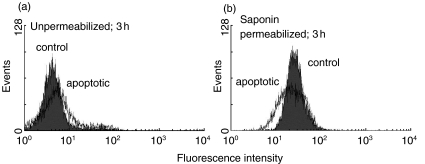
Fig. 4.
FACS analysis of PDC expression following saponin permeabilization. Flow cytometric analysis of anti-PDC staining of control Jurkat cells and cells 3 h following STS treatment in the (a) absence and (b) presence of saponin permeabilization. Shaded histograms show control cells and open histograms show STS-treated cells.

