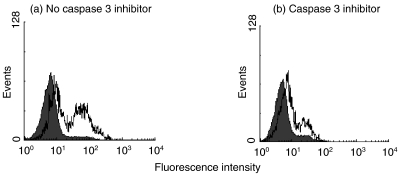
Fig. 6.
Effect of the Inhibition of caspase 3 on the cell surface expression of immunoreactive PDC by STS-treated Jurkat cells. Typical flow cytometric analysis of anti-PDC stained Jurkat cells 18 h after the addition of STS. (a) Fluorescence of cells treated with STS in the absence of the caspase 3 inhibitor (54% of the cells show positive fluorescence). (b) Fluorescence of cells treated with STS in the presence of the DEVD-CHO inhibitor (21% of the cells show positive fluorescence). Shaded histograms show non-STS treated control cells; open histograms show STS-treated cells.

