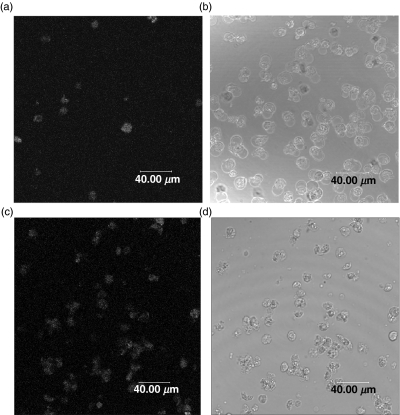
Fig. 7.
Confocal microscopy of anti-PDC treated cells following STS induction of apoptosis. (a) and (b) show paired immunofluorescence and phase contrast images of unpermeabilized control Jurkat cells, while (c) and (d) show paired images of unpermeabilized cells after treatment with STS for 18 h. Few of the control cells show cell surface PDC expression (consistent with spontaneous apoptosis) while the majority of STS treated cells show the presence of this antigen on the cell surface.

