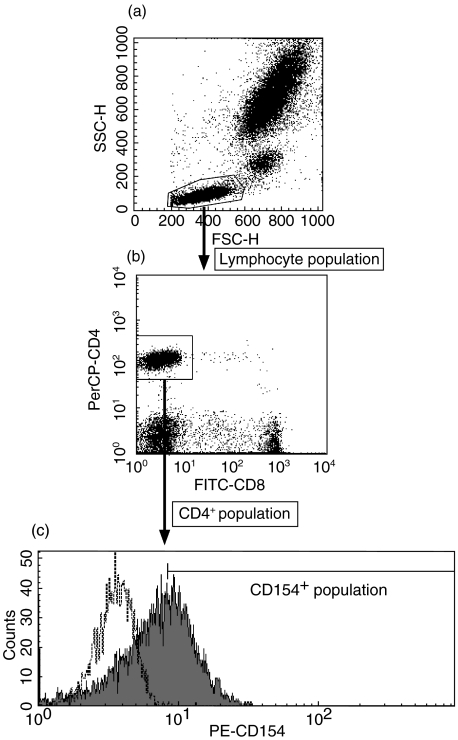
Fig. 1.
The typical profile of flow cytometry in analysing CD4+CD154+ T cells. (a) Forward- and side-scatter dot plot (b) FITC-CD8 and PerCP-CD4 fluorescence dot plot, and (c) PE-CD154 fluorescence histogram in control sample are shown. Examined sample (——) and isotype-matched IgG control (——) are plotted in (c). Fluorescence is shown as value before standardization.

