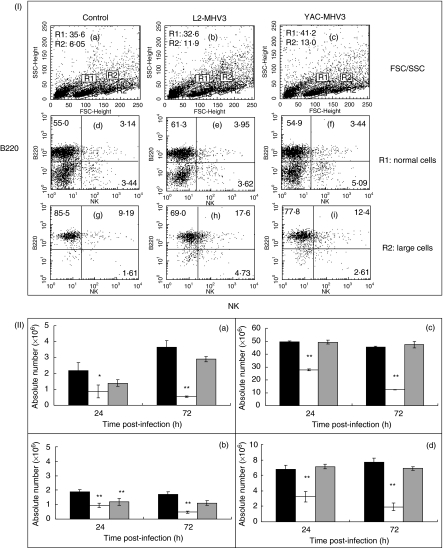
Fig. 1.
Section I: flow cytometric analysis of normal (R1 region) (d, e, f) and larger (R2 region) (g, h, i) NK+ and B220+ lymphoid cells in spleen from mock-infected (a, d and g), and L2-MHV3- (b, e and h) and YAC-MHV3- (c, f and i) infected C57BL/6 mice at 72 h p.i. Myeloid lymphocytes were double-labelled using anti-NK1·1-PE and anti-B220-FITC MoAbs and were analysed using a FACScan flow cytometer on a total of 10 000 events recorded. Section II: absolute numbers of normal (a and c) and larger (b and d) NK1·1+ cells (a and b) and B220+ lymphocytes (c and d) in spleen from mock-infected (▪), L2-MHV3- ( ) and YAC-MHV3- (□) infected C57BL/6 mice at 24 h p.i. Splenic lymphocytes were double-labelled using anti-NK1·1−PE and anti-B220-FITC MoAbs and were analysed using a FACScan flow cytometer on a total of 10 000 events recorded. The results are representative of three experiments. *P < 0·05; **P < 0·001.

